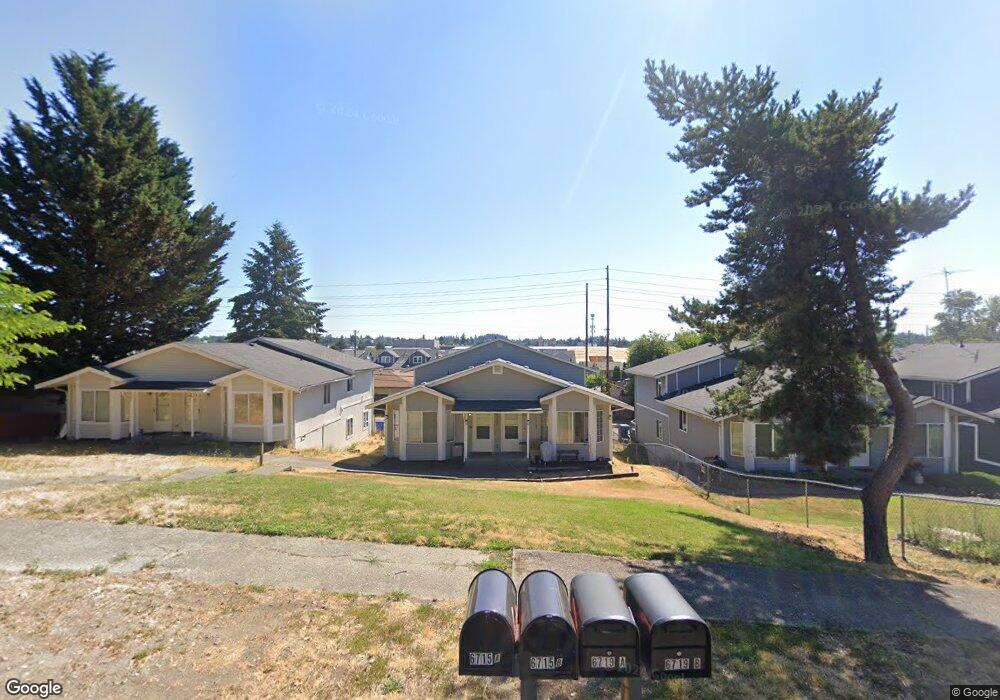
6719 S Monroe St Unit A&B Tacoma, WA 98409
South Tacoma NeighborhoodEstimated Value: $525,444 - $606,000
6
Beds
2
Baths
1,709
Sq Ft
$329/Sq Ft
Est. Value
About This Home
This home is located at 6719 S Monroe St Unit A&B, Tacoma, WA 98409 and is currently estimated at $561,861, approximately $328 per square foot. 6719 S Monroe St Unit A&B is a home located in Pierce County with nearby schools including Manitou Park Elementary School, Gray Middle School, and Mount Tahoma High School.
Ownership History
Date
Name
Owned For
Owner Type
Purchase Details
Closed on
Nov 19, 2022
Sold by
Boetcher Daniel J
Bought by
Mclemore-West Dela O and Mclemore-West Robert
Current Estimated Value
Home Financials for this Owner
Home Financials are based on the most recent Mortgage that was taken out on this home.
Original Mortgage
$539,988
Outstanding Balance
$523,243
Interest Rate
6.95%
Mortgage Type
FHA
Estimated Equity
$38,618
Purchase Details
Closed on
Jul 14, 2003
Sold by
Wheeler Michael J
Bought by
Boetcher Daniel J
Home Financials for this Owner
Home Financials are based on the most recent Mortgage that was taken out on this home.
Original Mortgage
$112,500
Interest Rate
5.18%
Mortgage Type
Purchase Money Mortgage
Purchase Details
Closed on
Apr 13, 1999
Sold by
Krause Gary P
Bought by
Wheeler Michael J
Home Financials for this Owner
Home Financials are based on the most recent Mortgage that was taken out on this home.
Original Mortgage
$92,000
Interest Rate
7.1%
Create a Home Valuation Report for This Property
The Home Valuation Report is an in-depth analysis detailing your home's value as well as a comparison with similar homes in the area
Home Values in the Area
Average Home Value in this Area
Purchase History
| Date | Buyer | Sale Price | Title Company |
|---|---|---|---|
| Mclemore-West Dela O | -- | Wfg National Title Company Of | |
| Boetcher Daniel J | $125,000 | Pst | |
| Wheeler Michael J | $133,790 | -- |
Source: Public Records
Mortgage History
| Date | Status | Borrower | Loan Amount |
|---|---|---|---|
| Open | Mclemore-West Dela O | $539,988 | |
| Previous Owner | Boetcher Daniel J | $112,500 | |
| Previous Owner | Wheeler Michael J | $92,000 |
Source: Public Records
Tax History Compared to Growth
Tax History
| Year | Tax Paid | Tax Assessment Tax Assessment Total Assessment is a certain percentage of the fair market value that is determined by local assessors to be the total taxable value of land and additions on the property. | Land | Improvement |
|---|---|---|---|---|
| 2025 | $5,524 | $535,300 | $206,400 | $328,900 |
| 2024 | $5,524 | $539,800 | $199,400 | $340,400 |
| 2023 | $5,524 | $496,300 | $190,800 | $305,500 |
| 2022 | $4,770 | $466,600 | $179,200 | $287,400 |
| 2021 | $4,482 | $356,600 | $112,700 | $243,900 |
| 2019 | $3,585 | $329,800 | $92,200 | $237,600 |
| 2018 | $3,800 | $275,800 | $80,200 | $195,600 |
| 2017 | $3,155 | $240,500 | $53,000 | $187,500 |
| 2016 | $2,826 | $177,900 | $36,700 | $141,200 |
| 2014 | $2,696 | $162,500 | $35,000 | $127,500 |
| 2013 | $2,696 | $146,900 | $35,000 | $111,900 |
Source: Public Records
Map
Nearby Homes
- 4114 S 67th St
- 6610 S Madison St
- 6604 S Madison St
- 4611 S Reade St
- 4003 S 74th St Unit C
- 4316 S Burkhart Dr
- 4709 S American Lake Blvd
- 6825 S Puget Sound Ave
- 6401 S Puget Sound Ave
- 4443 S 76th Street Ct
- 6002 S Mason Ave
- 6240 S Warner St
- 6825 S Lawrence St
- 6018 S Cheyenne St
- 3303 S 64th St
- 6812 S Huson St
- 6226 S Lawrence St
- 7811 S Verde St
- 6202 S Ferdinand St
- 6209 S Lawrence St
- 6719 S Monroe St Unit 6719 S Monroe St Uni
- 6719 S Monroe St
- 6715 S Monroe St Unit B
- 6715 S Monroe St
- 6715 S Monroe St Unit A & B
- 6715 S Monroe St
- 6723 S Monroe St
- 6711 S Monroe St
- 6729 S Monroe St
- 6722 S Madison St
- 6707 S Monroe St
- 6716 S Madison St Unit 6718
- 6733 S Monroe St
- 6716 6718 S Madison St
- 6728 S Madison St
- 6722 S Monroe St Unit A & B
- 6714 S Monroe St
- 6710 S Madison St
- 6728 S Monroe St
- 6734 6738 S Madison St