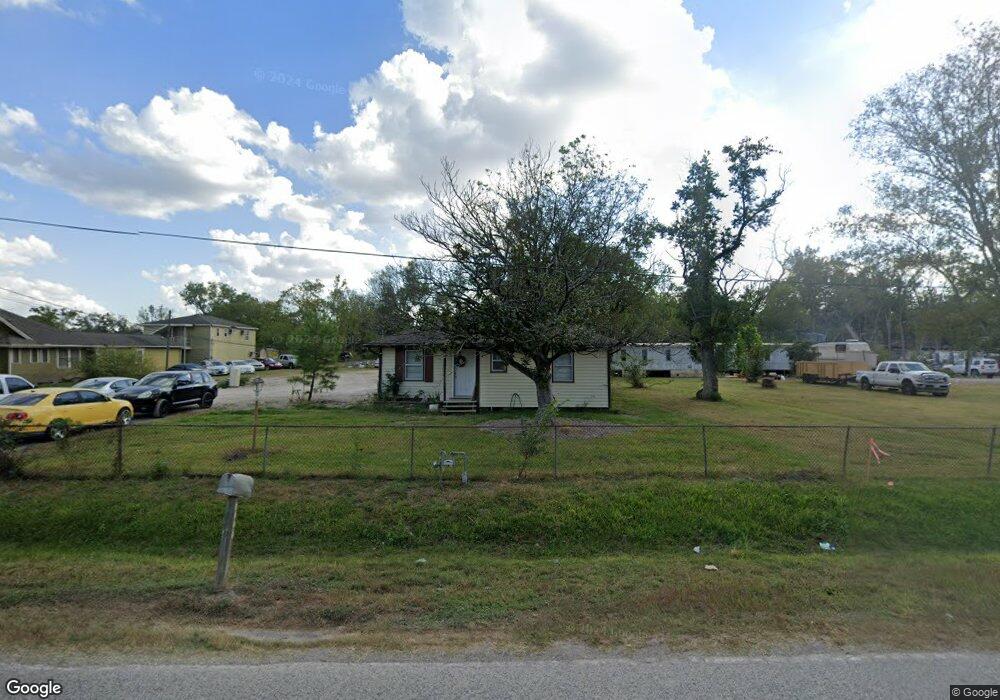
6719 Spindle Dr Houston, TX 77086
Recreation Farms NeighborhoodEstimated Value: $348,000 - $733,000
3
Beds
1
Bath
840
Sq Ft
$590/Sq Ft
Est. Value
About This Home
This home is located at 6719 Spindle Dr, Houston, TX 77086 and is currently estimated at $495,708, approximately $590 per square foot. 6719 Spindle Dr is a home located in Harris County with nearby schools including Eiland Elementary School, Klein Intermediate School, and Klein Forest High School.
Ownership History
Date
Name
Owned For
Owner Type
Purchase Details
Closed on
Nov 4, 2019
Sold by
Ayers Orlean and Ayers Edna
Bought by
Jopez Oscar Rene and Lopez Elena Aguirre
Current Estimated Value
Purchase Details
Closed on
Oct 11, 2002
Sold by
Sanders B G and Sanders Gloria J
Bought by
Ayers Orlean and Ayers Edna
Home Financials for this Owner
Home Financials are based on the most recent Mortgage that was taken out on this home.
Original Mortgage
$112,500
Interest Rate
5.65%
Mortgage Type
Seller Take Back
Purchase Details
Closed on
Sep 5, 2002
Sold by
Sanders B G
Bought by
Sanders Gloria J
Home Financials for this Owner
Home Financials are based on the most recent Mortgage that was taken out on this home.
Original Mortgage
$112,500
Interest Rate
5.65%
Mortgage Type
Seller Take Back
Create a Home Valuation Report for This Property
The Home Valuation Report is an in-depth analysis detailing your home's value as well as a comparison with similar homes in the area
Home Values in the Area
Average Home Value in this Area
Purchase History
| Date | Buyer | Sale Price | Title Company |
|---|---|---|---|
| Jopez Oscar Rene | -- | Charter Title Company | |
| Ayers Orlean | -- | -- | |
| Sanders Gloria J | -- | -- | |
| Sanders B G | -- | First American Title |
Source: Public Records
Mortgage History
| Date | Status | Borrower | Loan Amount |
|---|---|---|---|
| Previous Owner | Ayers Orlean | $112,500 |
Source: Public Records
Tax History Compared to Growth
Tax History
| Year | Tax Paid | Tax Assessment Tax Assessment Total Assessment is a certain percentage of the fair market value that is determined by local assessors to be the total taxable value of land and additions on the property. | Land | Improvement |
|---|---|---|---|---|
| 2025 | $6,463 | $398,132 | $381,132 | $17,000 |
| 2024 | $6,463 | $360,000 | $350,000 | $10,000 |
| 2023 | $6,463 | $281,600 | $254,088 | $27,512 |
| 2022 | $5,362 | $259,600 | $232,914 | $26,686 |
| 2021 | $2,444 | $111,657 | $84,696 | $26,961 |
| 2020 | $2,083 | $91,183 | $63,522 | $27,661 |
| 2019 | $2,164 | $91,183 | $63,522 | $27,661 |
| 2018 | $198 | $91,183 | $63,522 | $27,661 |
| 2017 | $4,328 | $91,183 | $63,522 | $27,661 |
| 2016 | $2,164 | $91,183 | $63,522 | $27,661 |
| 2015 | $502 | $93,082 | $63,522 | $29,560 |
| 2014 | $502 | $93,082 | $63,522 | $29,560 |
Source: Public Records
Map
Nearby Homes
- 6902 Breen Dr
- 6713 Breen Dr
- 7122 Breen Dr
- 5624 Spindle Dr
- 6011 Killough St
- 5930 Killough St
- 6222 Downwood Forest Dr
- 8918 Bold Forest Dr
- 00 Romona Blvd
- 5721 Breen Dr
- 5831 Longforest Dr
- 12610 Twilight Bend Ct
- 5626 Spindle Dr
- 5718 Longforest Dr
- 6006 Ogden Forest Dr
- 6111 Ogden Forest Dr
- 7535 Roaring Springs Dr
- 5638 Fairview Forest Dr
- 8810 Enchanted Forest Dr
- 6122 Gallant Forest Dr
- 6722 Spindle Dr
- 6715 Spindle Dr
- 6713 Spindle Dr
- 6807 Spindle Dr
- 6711 Spindle Dr
- 6714 Spindle Dr
- 6718 Spindle Dr
- 6810 Spindle Dr
- 6808 Spindle Dr
- 6712 Spindle Dr
- 6709 Spindle Dr
- 6811 Spindle Dr
- 6710 Spindle Dr
- 6814 Spindle Dr
- 6815 Spindle Dr
- 6818 Spindle Dr
- 6631 Spindle Dr
- 6710 Breen Dr
- 6802 Breen Dr
- 6630 Breen Dr