672 Common St Walpole, MA 02081
Walpole AreaEstimated Value: $844,000 - $1,064,000
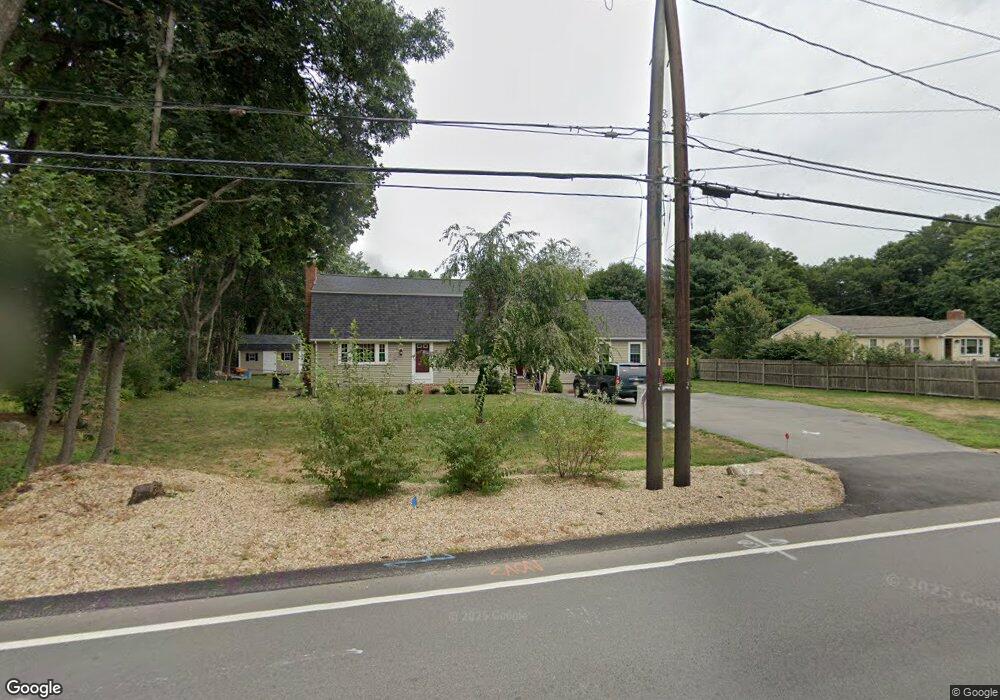
About This Home
This home is located at 672 Common St, Walpole, MA 02081 and is currently estimated at $937,443, approximately $320 per square foot. 672 Common St is a home located in Norfolk County with nearby schools including Boyden School, Eleanor N. Johnson Middle School, and Walpole High School.
Ownership History
We collect this data history from publicly available records. To have your information removed, we recommend requesting removal directly through your county’s website.
Purchase Details
Home Financials for this Owner
Home Financials are based on the most recent Mortgage that was taken out on this home.Home Values in the Area
Average Home Value in this Area
Purchase History
We collect this data history from publicly available records. To have your information removed, we recommend requesting removal directly through your county’s website.
| Date | Buyer | Sale Price | Title Company |
|---|---|---|---|
| $400,000 | -- |
Mortgage History
We collect this data history from publicly available records. To have your information removed, we recommend requesting removal directly through your county’s website.
| Date | Status | Borrower | Loan Amount |
|---|---|---|---|
| Open | $160,000 | ||
| Open | $265,000 | ||
| Closed | $120,000 | ||
| Closed | $55,000 | ||
| Closed | $300,000 | ||
| Previous Owner | $200,000 |
Tax History
We collect this data history from publicly available records. To have your information removed, we recommend requesting removal directly through your county’s website.
| Year | Tax Paid | Tax Assessment Tax Assessment Total Assessment is a certain percentage of the fair market value that is determined by local assessors to be the total taxable value of land and additions on the property. | Land | Improvement |
|---|---|---|---|---|
| 2025 | $10,446 | $814,200 | $294,200 | $520,000 |
| 2024 | $9,245 | $699,300 | $282,800 | $416,500 |
| 2023 | $8,790 | $632,800 | $245,900 | $386,900 |
| 2022 | $8,226 | $568,900 | $227,800 | $341,100 |
| 2021 | $8,092 | $545,300 | $214,800 | $330,500 |
| 2020 | $7,753 | $517,200 | $202,700 | $314,500 |
| 2019 | $7,481 | $495,400 | $194,900 | $300,500 |
| 2018 | $7,363 | $482,200 | $188,100 | $294,100 |
| 2017 | $7,159 | $467,000 | $180,900 | $286,100 |
| 2016 | $6,948 | $446,500 | $173,900 | $272,600 |
| 2015 | $6,759 | $430,500 | $165,700 | $264,800 |
| 2014 | $6,417 | $407,200 | $165,700 | $241,500 |
Map
- 15 Morningside Dr
- 635 Old Post Rd Unit 2-303
- 0 U S Route 1
- 510 Common St
- 665 South St
- 1468 Washington St
- 142 Baker St
- 40 Neal St
- 21 Grover St
- 1549 Washington St Unit 2
- 1549 Washington St Unit 1
- 261 Stone St
- 1 Montaup Rd
- 180/208 Old Post Rd Unit 208
- 8 Rainbow Pond Dr Unit 5
- 145 South St Unit 6
- 201 Stone St
- 87 Pine St
- 745 Washington St
- 5 Whiting Ave
- 676 Common St
- 7 Hawthorne Dr
- 680 Common St
- 3 Hawthorne Dr
- 8 Morningside Dr
- 670 Common St
- 7 Morningside Dr
- 671 Common St
- 684 Common St
- 929 Old Post Rd
- 3 Flonun St
- 673 Common St
- 656 Common St
- 8 Hawthorne Dr
- 16 Morningside Dr
- 661 Common St
- 5 Flonun St
- 688 Common St
- 688 Common St Unit 1
- 688 Common St Unit 2
Ask me questions while you tour the home.