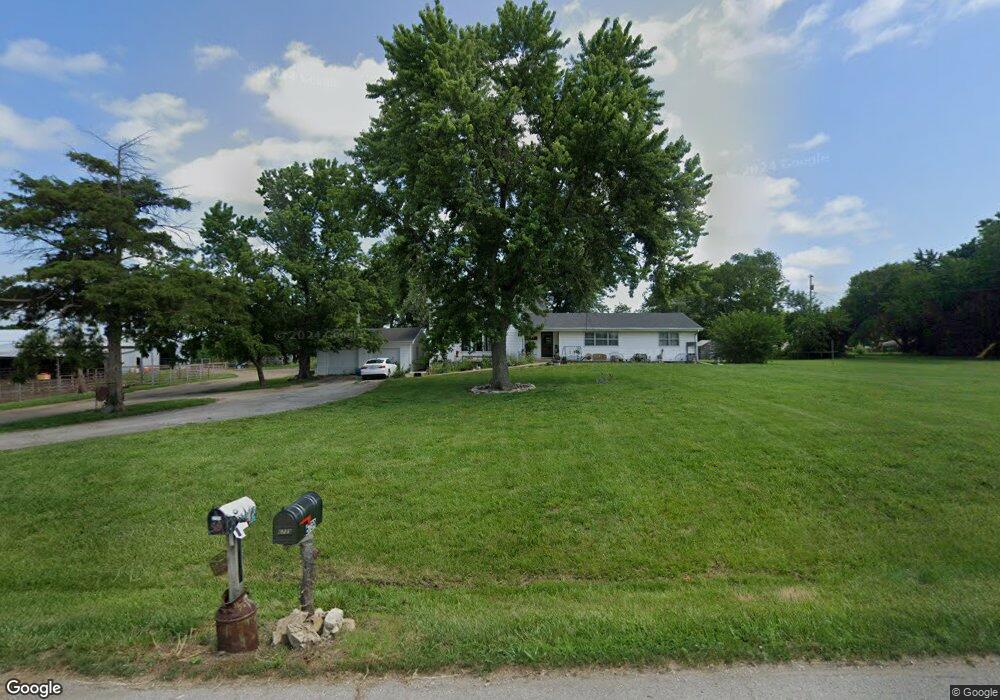
6720 E 213th St Quenemo, KS 66528
Estimated Value: $158,000 - $327,010
4
Beds
2
Baths
2,677
Sq Ft
$91/Sq Ft
Est. Value
About This Home
This home is located at 6720 E 213th St, Quenemo, KS 66528 and is currently estimated at $242,505, approximately $90 per square foot. 6720 E 213th St is a home located in Osage County with nearby schools including Appanoose Elementary School, West Franklin Middle School, and West Franklin High School.
Create a Home Valuation Report for This Property
The Home Valuation Report is an in-depth analysis detailing your home's value as well as a comparison with similar homes in the area
Tax History
| Year | Tax Paid | Tax Assessment Tax Assessment Total Assessment is a certain percentage of the fair market value that is determined by local assessors to be the total taxable value of land and additions on the property. | Land | Improvement |
|---|---|---|---|---|
| 2025 | $4,037 | $31,731 | $1,874 | $29,857 |
| 2024 | $40 | $30,781 | $1,885 | $28,896 |
| 2023 | $4,036 | $29,430 | $1,071 | $28,359 |
| 2022 | -- | $25,355 | $1,203 | $24,152 |
| 2021 | $0 | $21,327 | $2,036 | $19,291 |
| 2020 | $3,164 | $20,622 | $2,027 | $18,595 |
| 2019 | $2,935 | $18,857 | $1,648 | $17,209 |
| 2018 | $2,980 | $18,815 | $1,342 | $17,473 |
| 2017 | $2,705 | $18,510 | $1,321 | $17,189 |
| 2016 | $2,568 | $17,374 | $1,303 | $16,071 |
| 2015 | -- | $16,923 | $1,288 | $15,635 |
| 2013 | -- | $15,976 | $1,347 | $14,629 |
Source: Public Records
Map
Nearby Homes
- 00000 E 197th St
- 21015 N Sail A Way Dr
- 00000 E 209th St
- Croco RD E 189th St
- 18541 S Stanley Rd
- 4584 Mucho Gusto
- 22502 Sunset Dr
- 2915 Oak Hill Rd
- 2806 Main St
- 0 Reno Rd
- 23227 Elm St
- 0000 S Ratner Rd
- 20031 S Berryton Rd
- 628 Monroe St
- 16878 S Ratner Rd
- 216 W 4th St
- 211 Harrison St
- 325 Monroe St
- 415 Taylor St
- 424 N 5th St
- 6750 E 213th St
- 21261 S Hickory Rd
- 6757 E 213th St
- 6739 E 213th St
- 6771 E 213th St
- 6780 E 213th St
- 21256 S Hickory Rd
- 21254 S Hickory Rd
- 21244 S Hickory Rd
- 6685 E 213th St
- 6795 E 213th St
- 6663 E 213th St
- 6800 E 213th St
- 21273 S Michigan Rd
- 6823 E 213th St
- 21227 S Hickory Rd
- 21249 S Michigan Rd
- 21256 S Michigan Rd
- 6853 E 213th St
- 21258 S Michigan Rd