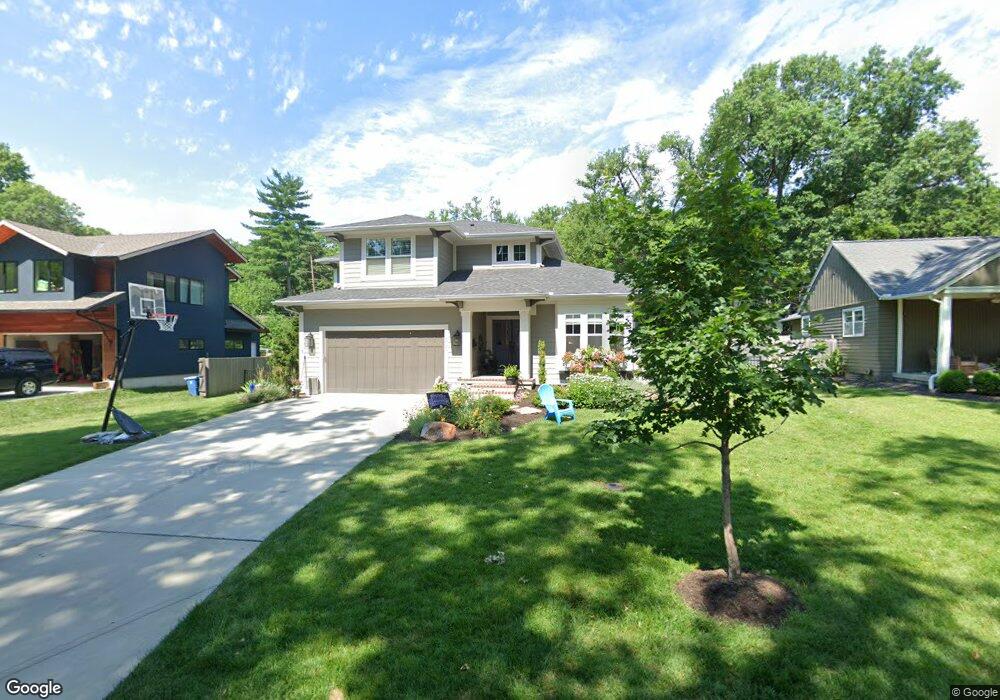
6720 Fontana St Prairie Village, KS 66208
Estimated Value: $470,000 - $1,476,000
4
Beds
2
Baths
2,851
Sq Ft
$382/Sq Ft
Est. Value
About This Home
This home is located at 6720 Fontana St, Prairie Village, KS 66208 and is currently estimated at $1,089,959, approximately $382 per square foot. 6720 Fontana St is a home located in Johnson County with nearby schools including Prairie Elementary School, Indian Hills Middle School, and Shawnee Mission East High School.
Ownership History
Date
Name
Owned For
Owner Type
Purchase Details
Closed on
Jun 26, 2017
Sold by
Roeser Homes Llc
Bought by
Monger Brett A and Monger Gina M
Current Estimated Value
Home Financials for this Owner
Home Financials are based on the most recent Mortgage that was taken out on this home.
Original Mortgage
$523,310
Outstanding Balance
$436,328
Interest Rate
4.02%
Mortgage Type
New Conventional
Estimated Equity
$653,632
Purchase Details
Closed on
Dec 14, 2015
Sold by
Cherry Park Properties Llc
Bought by
Roeser Homes Llc
Purchase Details
Closed on
Apr 22, 2005
Sold by
Gleason Patrick J and Gleason Megan E
Bought by
Fleischer Aaron E
Home Financials for this Owner
Home Financials are based on the most recent Mortgage that was taken out on this home.
Original Mortgage
$42,790
Interest Rate
5.6%
Mortgage Type
Stand Alone Second
Create a Home Valuation Report for This Property
The Home Valuation Report is an in-depth analysis detailing your home's value as well as a comparison with similar homes in the area
Home Values in the Area
Average Home Value in this Area
Purchase History
| Date | Buyer | Sale Price | Title Company |
|---|---|---|---|
| Monger Brett A | -- | None Available | |
| Roeser Homes Llc | -- | Kansas City Title | |
| Fleischer Aaron E | -- | First American Title |
Source: Public Records
Mortgage History
| Date | Status | Borrower | Loan Amount |
|---|---|---|---|
| Open | Monger Brett A | $523,310 | |
| Previous Owner | Fleischer Aaron E | $42,790 | |
| Previous Owner | Fleischer Aaron E | $171,160 |
Source: Public Records
Tax History Compared to Growth
Tax History
| Year | Tax Paid | Tax Assessment Tax Assessment Total Assessment is a certain percentage of the fair market value that is determined by local assessors to be the total taxable value of land and additions on the property. | Land | Improvement |
|---|---|---|---|---|
| 2024 | $14,609 | $126,799 | $22,025 | $104,774 |
| 2023 | $12,835 | $110,791 | $20,978 | $89,813 |
| 2022 | $11,648 | $100,476 | $18,239 | $82,237 |
| 2021 | $11,668 | $96,106 | $18,239 | $77,867 |
| 2020 | $12,103 | $98,682 | $16,583 | $82,099 |
| 2019 | $11,066 | $89,551 | $13,820 | $75,731 |
| 2018 | $10,529 | $84,939 | $12,563 | $72,376 |
| 2017 | $1,737 | $12,375 | $9,661 | $2,714 |
| 2016 | $2,873 | $21,390 | $6,897 | $14,493 |
| 2015 | $3,505 | $26,830 | $6,897 | $19,933 |
| 2013 | -- | $26,082 | $6,002 | $20,080 |
Source: Public Records
Map
Nearby Homes
- 6712 Granada Rd
- 4016 W 67th Terrace
- 4513 W 69th Terrace
- 4815 W 66th Terrace
- 4211 Homestead Dr
- 4805 W 66th St
- 3917 W 67th St
- 4519 W 70th St
- 4805 W 69th St
- 4811 W 65th Terrace
- 4909 W 68th St
- 4306 W 70th St
- 7000 Roe Ave
- 4009 Homestead Ct
- 4918 W 69th Terrace
- 5100 W 68th St
- 5013 W 65th Terrace
- 5200 W 69th St
- 4402 W 63rd Terrace
- 5214 W 66th Terrace
- 6714 Fontana St
- 6726 Fontana St
- 6711 Granada Rd
- 6723 Granada Rd
- 6708 Fontana St
- 6732 Fontana St
- 6707 Granada Rd
- 6717 Fontana St
- 6727 Granada Rd
- 6723 Fontana St
- 6713 Fontana St
- 6729 Fontana St
- 6700 Fontana St
- 6738 Fontana St
- 6701 Granada Rd
- 6735 Granada Rd
- 6735 Fontana St
- 6707 Fontana St
- 6742 Fontana St
- 6741 Granada Rd