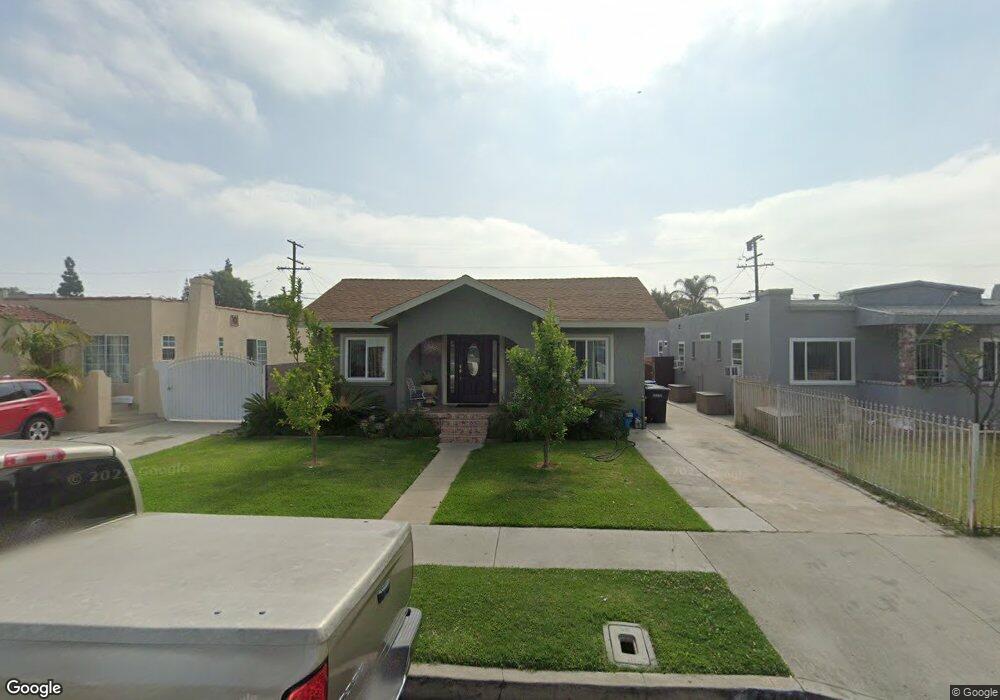
6720 Plaska Ave Huntington Park, CA 90255
Estimated Value: $646,976 - $733,000
3
Beds
2
Baths
1,032
Sq Ft
$674/Sq Ft
Est. Value
About This Home
This home is located at 6720 Plaska Ave, Huntington Park, CA 90255 and is currently estimated at $695,744, approximately $674 per square foot. 6720 Plaska Ave is a home located in Los Angeles County with nearby schools including Lucille Roybal-Allard Elementary, Henry T. Gage Middle School, and Huntington Park Senior High School.
Ownership History
Date
Name
Owned For
Owner Type
Purchase Details
Closed on
Nov 17, 2006
Sold by
Madrigal Josefina
Bought by
Madrigal Octavio
Current Estimated Value
Home Financials for this Owner
Home Financials are based on the most recent Mortgage that was taken out on this home.
Original Mortgage
$300,000
Outstanding Balance
$178,149
Interest Rate
6.28%
Mortgage Type
New Conventional
Estimated Equity
$517,595
Purchase Details
Closed on
May 15, 2002
Sold by
Madrigal Josefina
Bought by
Madrigal Octavio
Home Financials for this Owner
Home Financials are based on the most recent Mortgage that was taken out on this home.
Original Mortgage
$133,000
Interest Rate
7%
Purchase Details
Closed on
Dec 1, 1996
Sold by
Curiel Nicolas
Bought by
Madrigal Octavio and Madrigal Josefina
Home Financials for this Owner
Home Financials are based on the most recent Mortgage that was taken out on this home.
Original Mortgage
$109,356
Interest Rate
7.59%
Mortgage Type
FHA
Create a Home Valuation Report for This Property
The Home Valuation Report is an in-depth analysis detailing your home's value as well as a comparison with similar homes in the area
Home Values in the Area
Average Home Value in this Area
Purchase History
| Date | Buyer | Sale Price | Title Company |
|---|---|---|---|
| Madrigal Octavio | -- | Ticor Title Company | |
| Madrigal Octavio | -- | United Title Company | |
| Madrigal Octavio | $110,000 | Orange Coast Title |
Source: Public Records
Mortgage History
| Date | Status | Borrower | Loan Amount |
|---|---|---|---|
| Open | Madrigal Octavio | $300,000 | |
| Closed | Madrigal Octavio | $133,000 | |
| Closed | Madrigal Octavio | $109,356 |
Source: Public Records
Tax History Compared to Growth
Tax History
| Year | Tax Paid | Tax Assessment Tax Assessment Total Assessment is a certain percentage of the fair market value that is determined by local assessors to be the total taxable value of land and additions on the property. | Land | Improvement |
|---|---|---|---|---|
| 2025 | $3,572 | $207,733 | $141,354 | $66,379 |
| 2024 | $3,572 | $203,661 | $138,583 | $65,078 |
| 2023 | $3,439 | $199,668 | $135,866 | $63,802 |
| 2022 | $3,295 | $195,753 | $133,202 | $62,551 |
| 2021 | $3,248 | $191,916 | $130,591 | $61,325 |
| 2019 | $3,145 | $186,225 | $126,718 | $59,507 |
| 2018 | $3,016 | $182,575 | $124,234 | $58,341 |
| 2016 | $2,874 | $175,488 | $119,411 | $56,077 |
| 2015 | $2,826 | $172,853 | $117,618 | $55,235 |
| 2014 | $2,819 | $169,469 | $115,315 | $54,154 |
Source: Public Records
Map
Nearby Homes
- 6913 Plaska Ave
- 3267 E Gage Ave
- 3510 Nevada St
- 6356 Marconi St
- 3245 Live Oak St
- 2960 Clarendon Ave
- 4 beds/2.5 baths Plan at Amada Homes
- 3 bed/ 3 baths Plan at Amada Homes
- 4 beds/ 3 baths Plan at Amada Homes
- 6900 Templeton St
- 3633 Gage Ave
- 7015 Templeton St
- 3007 Flower St
- 2930 Live Oak St
- 2829 California St
- 7126 Stafford Ave
- 3735 Bear Ct
- 2938 E 60th Place
- 6000 Arbutus Ave Unit F
- 2749 Live Oak St
- 6724 Plaska Ave
- 6716 Plaska Ave
- 6712 Plaska Ave
- 6730 Plaska Ave
- 6723 Hood Ave
- 6727 Hood Ave
- 6717 Hood Ave
- 6804 Plaska Ave
- 6708 Plaska Ave
- 6713 Hood Ave
- 6731 Hood Ave
- 6721 Plaska Ave
- 6717 Plaska Ave
- 6725 Plaska Ave
- 6808 Plaska Ave
- 6702 Plaska Ave
- 6805 Hood Ave
- 6707 Hood Ave
- 6729 Plaska Ave
- 6809 Hood Ave