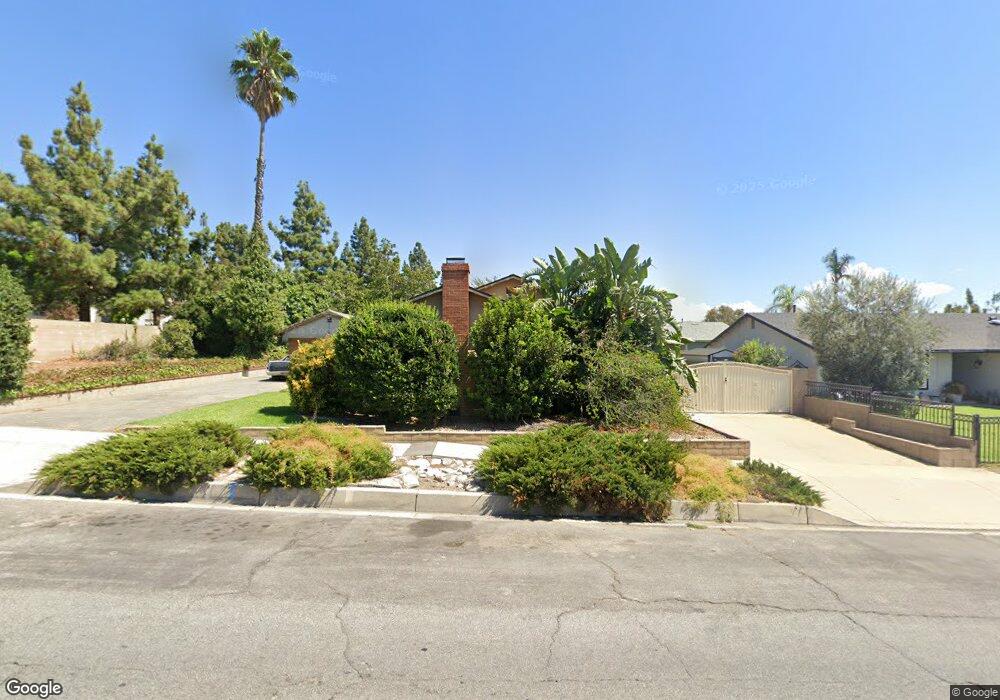
6721 Ramona Ave Rancho Cucamonga, CA 91701
Estimated Value: $680,319 - $945,000
3
Beds
2
Baths
1,196
Sq Ft
$663/Sq Ft
Est. Value
About This Home
This home is located at 6721 Ramona Ave, Rancho Cucamonga, CA 91701 and is currently estimated at $792,830, approximately $662 per square foot. 6721 Ramona Ave is a home located in San Bernardino County with nearby schools including Deer Canyon Elementary, Vineyard Junior High, and Los Osos High.
Ownership History
Date
Name
Owned For
Owner Type
Purchase Details
Closed on
Jul 29, 2020
Sold by
Hawker Robert and Hawker Frank
Bought by
Hawker Frank
Current Estimated Value
Purchase Details
Closed on
Dec 18, 2017
Sold by
Hawker Robert and Hawker Frank
Bought by
Hawker Robert and Hawker Frank
Create a Home Valuation Report for This Property
The Home Valuation Report is an in-depth analysis detailing your home's value as well as a comparison with similar homes in the area
Home Values in the Area
Average Home Value in this Area
Purchase History
| Date | Buyer | Sale Price | Title Company |
|---|---|---|---|
| Hawker Frank | $160,000 | None Available | |
| Hawker Robert | -- | None Available |
Source: Public Records
Tax History Compared to Growth
Tax History
| Year | Tax Paid | Tax Assessment Tax Assessment Total Assessment is a certain percentage of the fair market value that is determined by local assessors to be the total taxable value of land and additions on the property. | Land | Improvement |
|---|---|---|---|---|
| 2025 | $4,101 | $377,363 | $148,904 | $228,459 |
| 2024 | $4,101 | $369,963 | $145,984 | $223,979 |
| 2023 | $4,009 | $362,709 | $143,122 | $219,587 |
| 2022 | $3,999 | $355,597 | $140,316 | $215,281 |
| 2021 | $3,997 | $348,625 | $137,565 | $211,060 |
| 2020 | $789 | $67,168 | $21,100 | $46,068 |
| 2019 | $797 | $65,851 | $20,686 | $45,165 |
| 2018 | $780 | $64,559 | $20,280 | $44,279 |
| 2017 | $746 | $63,293 | $19,882 | $43,411 |
| 2016 | $727 | $62,052 | $19,492 | $42,560 |
| 2015 | $723 | $61,120 | $19,199 | $41,921 |
| 2014 | $703 | $59,923 | $18,823 | $41,100 |
Source: Public Records
Map
Nearby Homes
- 6740 London Ave
- 9740 Woodleaf Dr
- 10040 Jonquil Dr
- 6600 Montresor Place
- 6765 Jadeite Ave
- 10123 Finch Ave
- 6644 Brissac Place
- 9757 Balaton St
- 6949 Laguna Place Unit B1
- 6880 Archibald Ave Unit 114
- 6880 Archibald Ave Unit 27
- 6880 Archibald Ave Unit 40
- 7018 Princeton Place
- 6946 Archibald Ave
- 6360 Daylily Ct
- 6360 Calle Hermoso
- 10141 Orange St
- 9800 Baseline Rd Unit 76
- 9800 Baseline Rd Unit 71
- 9800 Baseline Rd Unit 17
- 6733 Ramona Ave
- 6705 Berkshire Ave
- 6715 Berkshire Ave
- 6743 Ramona Ave
- 6704 Berkshire Ave
- 6722 Ramona Ave
- 6712 Ramona Ave
- 6732 Ramona Ave
- 6753 Ramona Ave
- 6725 Berkshire Ave
- 6742 Ramona Ave
- 6714 Berkshire Ave
- 6725 Pasito Ave
- 6752 Ramona Ave
- 6721 Pasito Ave
- 6730 Berkshire Ave
- 6735 Pasito Ave
- 6735 Berkshire Ave
- 6745 Pasito Ave
- 6762 Ramona Ave