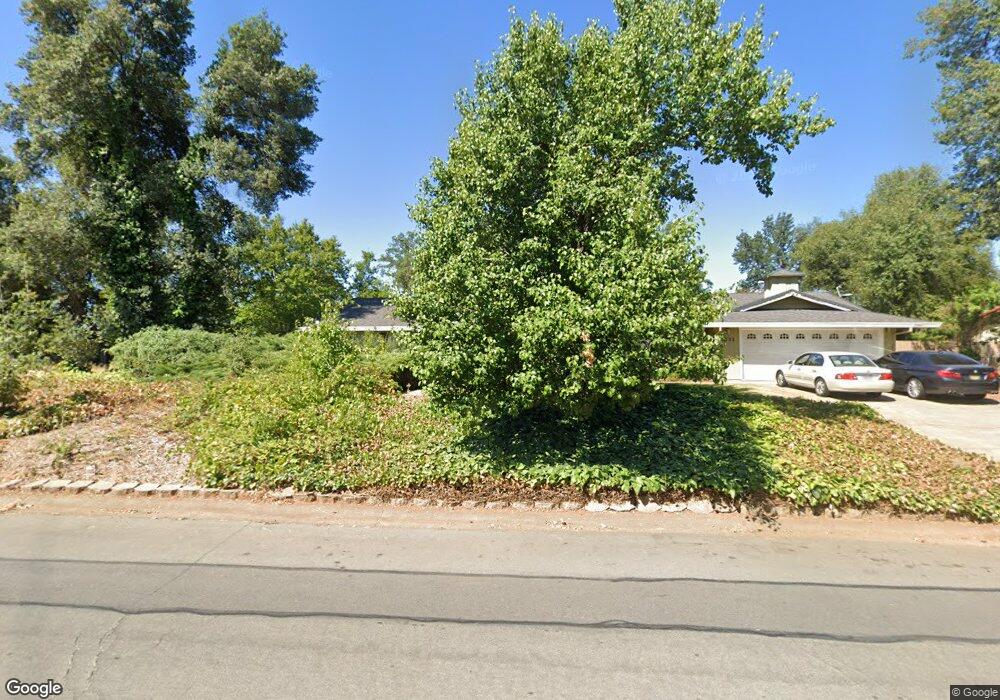
6722 Riata Dr Redding, CA 96002
Estimated Value: $452,673 - $509,000
3
Beds
2
Baths
2,090
Sq Ft
$231/Sq Ft
Est. Value
About This Home
This home is located at 6722 Riata Dr, Redding, CA 96002 and is currently estimated at $481,918, approximately $230 per square foot. 6722 Riata Dr is a home located in Shasta County with nearby schools including Prairie Elementary School, Pacheco Elementary School, and Northern Summit Academy.
Ownership History
Date
Name
Owned For
Owner Type
Purchase Details
Closed on
Oct 8, 2021
Sold by
Williams Evelyn J and Williams Kenneth W
Bought by
Williams Kenneth Wayne and Williams Evelyn Lander
Current Estimated Value
Purchase Details
Closed on
Aug 29, 2014
Sold by
Lander Evelyn J and Williams Kenneth W
Bought by
Lander Eveyln J and Williams Kenneth W
Home Financials for this Owner
Home Financials are based on the most recent Mortgage that was taken out on this home.
Original Mortgage
$230,743
Outstanding Balance
$178,330
Interest Rate
4.4%
Mortgage Type
FHA
Estimated Equity
$303,588
Purchase Details
Closed on
Oct 19, 2009
Sold by
Ruble Randall P
Bought by
Ruble Randall P
Purchase Details
Closed on
Dec 6, 1999
Sold by
Living Trust Ruble James G & Leatha M Tr Rubl
Bought by
Ruble James G and Ruble Leatha M
Create a Home Valuation Report for This Property
The Home Valuation Report is an in-depth analysis detailing your home's value as well as a comparison with similar homes in the area
Purchase History
| Date | Buyer | Sale Price | Title Company |
|---|---|---|---|
| Williams Kenneth Wayne | -- | None Available | |
| Lander Eveyln J | $235,000 | Placer Title Company | |
| Ruble Randall P | -- | None Available | |
| Ruble James G | -- | -- |
Source: Public Records
Mortgage History
| Date | Status | Borrower | Loan Amount |
|---|---|---|---|
| Open | Lander Eveyln J | $230,743 |
Source: Public Records
Tax History
| Year | Tax Paid | Tax Assessment Tax Assessment Total Assessment is a certain percentage of the fair market value that is determined by local assessors to be the total taxable value of land and additions on the property. | Land | Improvement |
|---|---|---|---|---|
| 2025 | $3,177 | $301,654 | $96,143 | $205,511 |
| 2024 | $3,114 | $295,740 | $94,258 | $201,482 |
| 2023 | $3,114 | $289,942 | $92,410 | $197,532 |
| 2022 | $3,036 | $284,258 | $90,599 | $193,659 |
| 2021 | $2,988 | $278,685 | $88,823 | $189,862 |
| 2020 | $2,952 | $275,829 | $87,913 | $187,916 |
| 2019 | $2,915 | $270,422 | $86,190 | $184,232 |
| 2018 | $2,800 | $265,120 | $84,500 | $180,620 |
| 2017 | $2,841 | $259,923 | $82,844 | $177,079 |
| 2016 | $2,686 | $254,827 | $81,220 | $173,607 |
| 2015 | $2,683 | $251,000 | $80,000 | $171,000 |
| 2014 | $1,671 | $153,836 | $25,700 | $128,136 |
Source: Public Records
Map
Nearby Homes
- 6639 Riata Dr
- 20350 Hole in One Dr
- 6927 Riata Dr
- 20260 River Valley Dr
- 7067 Tucker Ln
- 0 Milky Way
- 20573 Sunset Ln
- 20577 Sunset Ln
- 7530 Lockheed Dr
- 19964 Riverside Ave
- 7520 Lockheed Dr
- 7587 Fiesta Way
- 6673 Mountain View Dr
- 6950 Riverland Dr Unit 23
- 6950 Riverland Dr Unit 27
- 7100 Amigo Way
- 0 North St
- 3524 Gardenia St
- 7100 Milky Way
- 3503 Gardenia St
Your Personal Tour Guide
Ask me questions while you tour the home.