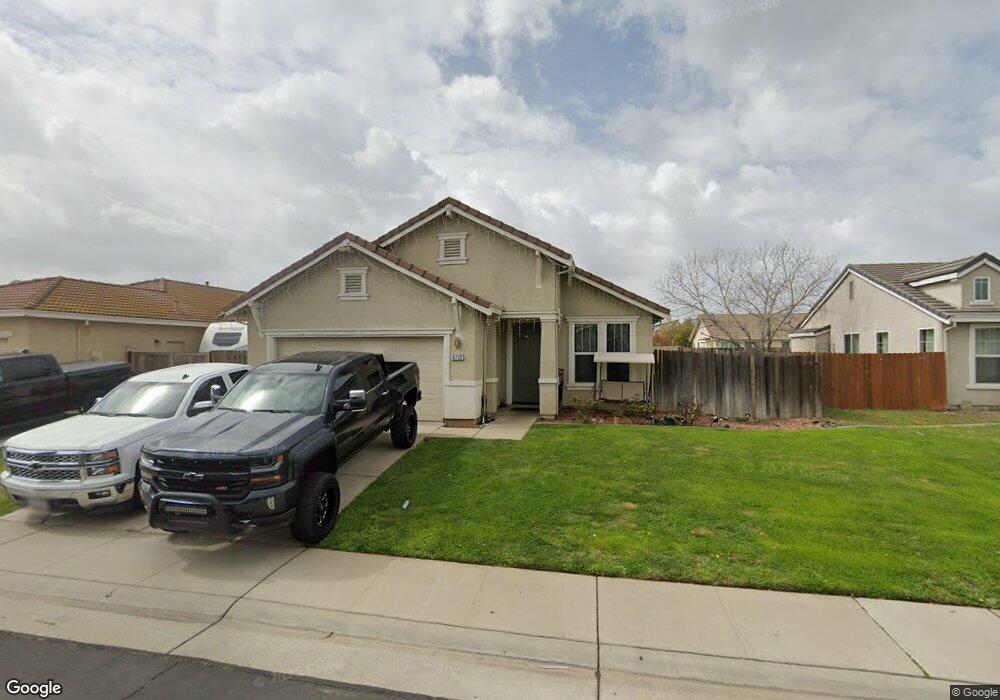
6722 Sandylee Way Sacramento, CA 95828
Estimated Value: $363,000 - $481,000
4
Beds
2
Baths
1,475
Sq Ft
$292/Sq Ft
Est. Value
About This Home
This home is located at 6722 Sandylee Way, Sacramento, CA 95828 and is currently estimated at $430,670, approximately $291 per square foot. 6722 Sandylee Way is a home located in Sacramento County with nearby schools including David Reese Elementary School, James Rutter Middle School, and Florin High School.
Ownership History
Date
Name
Owned For
Owner Type
Purchase Details
Closed on
Jul 2, 2016
Sold by
Molina Augustin
Bought by
Barrgan Teresa
Current Estimated Value
Purchase Details
Closed on
Sep 27, 2005
Sold by
Molina Roberto
Bought by
Barragan Teresa
Home Financials for this Owner
Home Financials are based on the most recent Mortgage that was taken out on this home.
Original Mortgage
$249,076
Interest Rate
5.53%
Mortgage Type
Purchase Money Mortgage
Purchase Details
Closed on
Aug 17, 2005
Sold by
Beazer Homes Holdings Corp
Bought by
Barragan Teresa and Molina Augustin
Home Financials for this Owner
Home Financials are based on the most recent Mortgage that was taken out on this home.
Original Mortgage
$249,076
Interest Rate
5.53%
Mortgage Type
Purchase Money Mortgage
Create a Home Valuation Report for This Property
The Home Valuation Report is an in-depth analysis detailing your home's value as well as a comparison with similar homes in the area
Home Values in the Area
Average Home Value in this Area
Purchase History
| Date | Buyer | Sale Price | Title Company |
|---|---|---|---|
| Barrgan Teresa | -- | None Available | |
| Barragan Teresa | -- | Chicago Title Co | |
| Barragan Teresa | $311,500 | Chicago Title Co |
Source: Public Records
Mortgage History
| Date | Status | Borrower | Loan Amount |
|---|---|---|---|
| Previous Owner | Barragan Teresa | $249,076 | |
| Previous Owner | Barragan Teresa | $31,134 |
Source: Public Records
Tax History Compared to Growth
Tax History
| Year | Tax Paid | Tax Assessment Tax Assessment Total Assessment is a certain percentage of the fair market value that is determined by local assessors to be the total taxable value of land and additions on the property. | Land | Improvement |
|---|---|---|---|---|
| 2025 | $4,014 | $357,793 | $103,136 | $254,657 |
| 2024 | $4,014 | $350,778 | $101,114 | $249,664 |
| 2023 | $3,916 | $343,901 | $99,132 | $244,769 |
| 2022 | $3,851 | $337,159 | $97,189 | $239,970 |
| 2021 | $3,809 | $330,549 | $95,284 | $235,265 |
| 2020 | $3,317 | $285,391 | $79,579 | $205,812 |
| 2019 | $3,121 | $266,721 | $74,373 | $192,348 |
| 2018 | $2,944 | $256,463 | $71,513 | $184,950 |
| 2017 | $2,772 | $239,686 | $66,835 | $172,851 |
| 2016 | $2,369 | $212,382 | $68,213 | $144,169 |
| 2015 | $2,164 | $193,075 | $62,012 | $131,063 |
| 2014 | $2,058 | $182,146 | $58,502 | $123,644 |
Source: Public Records
Map
Nearby Homes
- 7312 Del Prado Way
- 6944 Mirador Way
- 7548 Lindale Dr
- 6400 66th Ave Unit 21
- 7413 Skander Way
- 6124 Pomegranate Ave
- 7548 Huckleberry Ln
- 7451 Albezzia Ln
- 7551 Red Bud Ln
- 6837 Southwood Way
- 6104 Center Mall Way
- 5906 Stacy Ave
- 7020 Sunnyslope Dr
- 7206 Willowwest Ct
- 7618 Sunvaught Ln
- 7566 Sunmore Ln
- 7633 Clement Cir
- 7605 Mctavish Cir
- 7598 Sunmore Ln
- 7825 Rockhurst Way
- 6718 Sandylee Way
- 6726 Sandylee Way
- 7327 Del Prado Ct
- 6730 Sandylee Way
- 6714 Sandylee Way
- 7331 Del Prado Ct
- 7323 Del Prado Ct
- 6723 Sandylee Way
- 6719 Sandylee Way
- 7335 Del Prado Ct
- 7319 Del Prado Ct
- 7335 Del Prado Way
- 6727 Sandylee Way
- 6715 Sandylee Way
- 6734 Sandylee Way
- 6731 Sandylee Way
- 7339 Del Prado Ct
- 6711 Sandylee Way
- 6738 Sandylee Way
- 6701 Sandylee Way