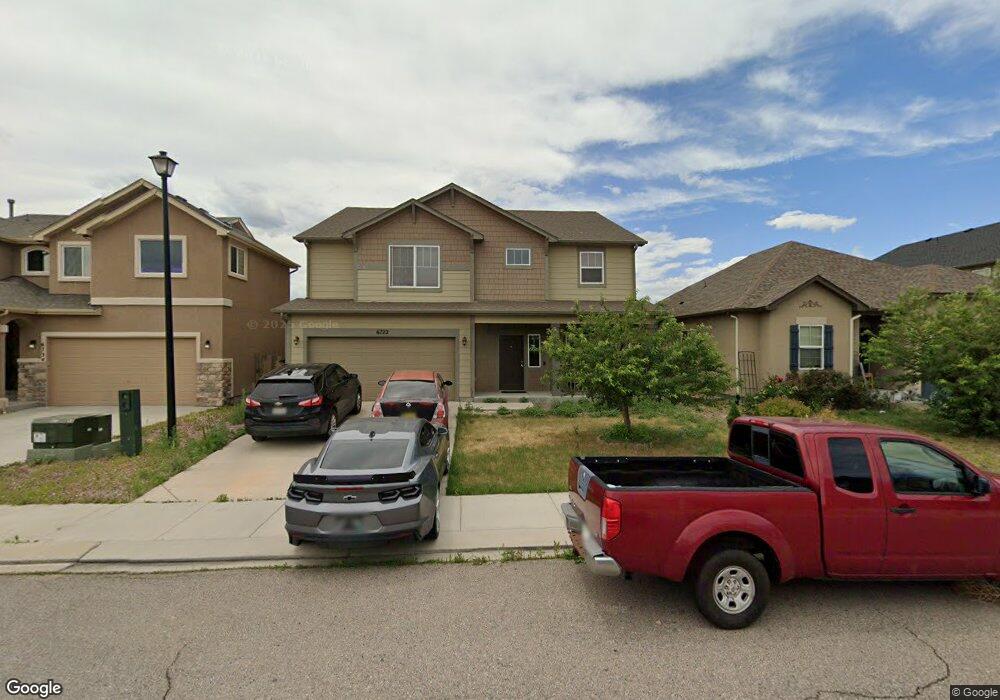
6722 Stingray Ln Colorado Springs, CO 80925
Widefield NeighborhoodEstimated Value: $486,747 - $552,000
4
Beds
3
Baths
3,380
Sq Ft
$155/Sq Ft
Est. Value
About This Home
This home is located at 6722 Stingray Ln, Colorado Springs, CO 80925 and is currently estimated at $524,187, approximately $155 per square foot. 6722 Stingray Ln is a home located in El Paso County with nearby schools including Grand Mountain School, Mesa Ridge High School, and Valley Christian Academy.
Ownership History
Date
Name
Owned For
Owner Type
Purchase Details
Closed on
Jan 7, 2020
Sold by
Hpa Us1 Llc
Bought by
Hpa Ii Borrower 2020 1 Ga Llc
Current Estimated Value
Purchase Details
Closed on
Jun 4, 2019
Sold by
Cristiani Brian A and Cristiani Dana L
Bought by
Hpa Us1 Llc
Purchase Details
Closed on
Aug 15, 2014
Sold by
Reunion Homes Inc
Bought by
Cristiani Brian A and Cristiani Dana L
Home Financials for this Owner
Home Financials are based on the most recent Mortgage that was taken out on this home.
Original Mortgage
$222,732
Interest Rate
4.16%
Mortgage Type
New Conventional
Purchase Details
Closed on
Aug 11, 2014
Sold by
Rh Mesa Ridge Llc
Bought by
Reunion Homes Inc
Home Financials for this Owner
Home Financials are based on the most recent Mortgage that was taken out on this home.
Original Mortgage
$222,732
Interest Rate
4.16%
Mortgage Type
New Conventional
Create a Home Valuation Report for This Property
The Home Valuation Report is an in-depth analysis detailing your home's value as well as a comparison with similar homes in the area
Home Values in the Area
Average Home Value in this Area
Purchase History
| Date | Buyer | Sale Price | Title Company |
|---|---|---|---|
| Hpa Ii Borrower 2020 1 Ga Llc | -- | None Available | |
| Hpa Us1 Llc | $368,000 | Stewart Title | |
| Cristiani Brian A | $296,500 | Empire Title Co Springs Llc | |
| Reunion Homes Inc | -- | None Available |
Source: Public Records
Mortgage History
| Date | Status | Borrower | Loan Amount |
|---|---|---|---|
| Previous Owner | Cristiani Brian A | $222,732 |
Source: Public Records
Tax History Compared to Growth
Tax History
| Year | Tax Paid | Tax Assessment Tax Assessment Total Assessment is a certain percentage of the fair market value that is determined by local assessors to be the total taxable value of land and additions on the property. | Land | Improvement |
|---|---|---|---|---|
| 2025 | $4,696 | $33,710 | -- | -- |
| 2024 | $4,655 | $34,890 | $6,040 | $28,850 |
| 2022 | $3,614 | $26,110 | $4,810 | $21,300 |
| 2021 | $3,763 | $26,860 | $4,950 | $21,910 |
| 2020 | $3,645 | $25,740 | $4,330 | $21,410 |
| 2019 | $3,633 | $25,740 | $4,330 | $21,410 |
| 2018 | $3,076 | $21,460 | $4,360 | $17,100 |
| 2017 | $3,140 | $21,460 | $4,360 | $17,100 |
| 2016 | $2,968 | $22,930 | $4,380 | $18,550 |
| 2015 | $3,126 | $22,930 | $4,380 | $18,550 |
| 2014 | $1,086 | $8,000 | $4,290 | $3,710 |
Source: Public Records
Map
Nearby Homes
- 10568 Kalama Dr
- 10670 Abrams Dr
- 6572 Justice Way
- 10634 Abrams Dr
- 6868 Alsea Dr
- 10250 Intrepid Way
- 6961 Maidford Dr
- 10179 Seawolf Dr
- 6716 Volga Dr
- 6706 Volga Dr
- 10573 Luneth Dr
- 10405 Abrams Dr
- 10721 Yuba Dr
- 10202 Abrams Dr
- 10208 Abrams Dr
- 10394 Abrams Dr
- 10525 Abrams Dr
- 10442 Abrams Dr
- 10600 Horton Dr
- 10384 Horton Dr
- 6710 Stingray Ln
- 6734 Stingray Ln
- 6710 Alliance Loop
- 6746 Stingray Ln
- 6698 Stingray Ln
- 6718 Alliance Loop
- 6686 Stingray Ln
- 6726 Alliance Loop
- 6758 Stingray Ln
- 6711 Stingray Ln
- 10425 Hoke Run Dr
- 6734 Alliance Loop
- 6674 Stingray Ln
- 6699 Stingray Ln
- 6694 Alliance Loop
- 6687 Stingray Ln
- 10439 Hoke Run Dr
- 6742 Alliance Loop
- 6662 Stingray Ln
- 6686 Alliance Loop