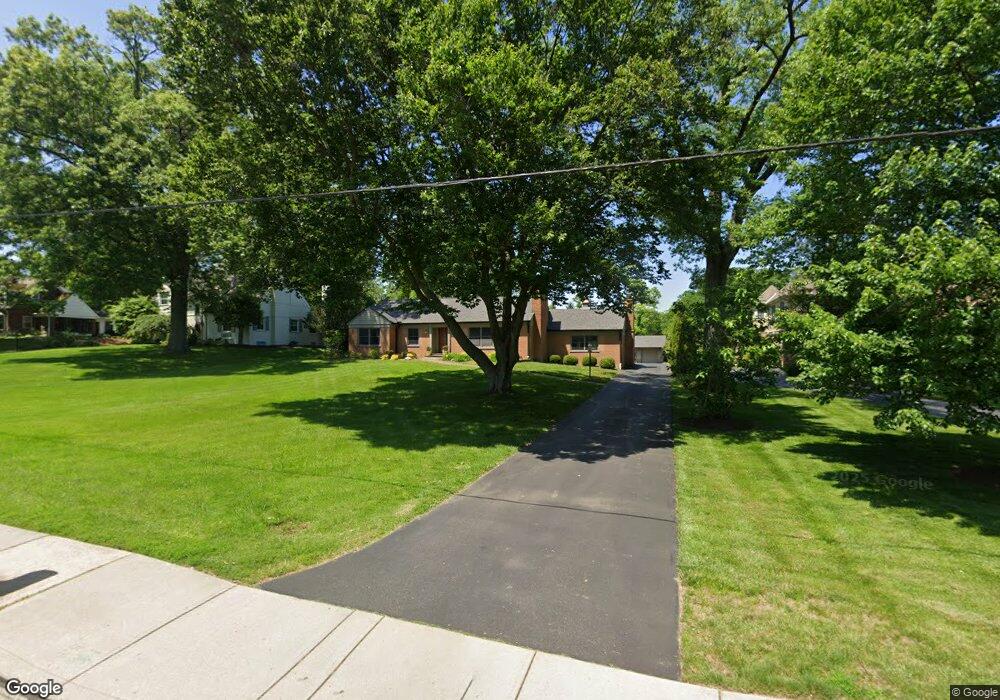
6724 Shawnee Run Rd Cincinnati, OH 45243
Estimated Value: $643,000 - $1,080,000
4
Beds
4
Baths
3,047
Sq Ft
$260/Sq Ft
Est. Value
About This Home
This home is located at 6724 Shawnee Run Rd, Cincinnati, OH 45243 and is currently estimated at $790,849, approximately $259 per square foot. 6724 Shawnee Run Rd is a home located in Hamilton County with nearby schools including Madeira Elementary School, Madeira Middle School, and Madeira High School.
Ownership History
Date
Name
Owned For
Owner Type
Purchase Details
Closed on
Mar 30, 1995
Sold by
Eccles Theda M and Eccles Earle R
Bought by
Jacobs Jeffrey W and Jacobs Bernadette M
Current Estimated Value
Home Financials for this Owner
Home Financials are based on the most recent Mortgage that was taken out on this home.
Original Mortgage
$145,000
Interest Rate
8.91%
Create a Home Valuation Report for This Property
The Home Valuation Report is an in-depth analysis detailing your home's value as well as a comparison with similar homes in the area
Home Values in the Area
Average Home Value in this Area
Purchase History
| Date | Buyer | Sale Price | Title Company |
|---|---|---|---|
| Jacobs Jeffrey W | -- | -- |
Source: Public Records
Mortgage History
| Date | Status | Borrower | Loan Amount |
|---|---|---|---|
| Previous Owner | Jacobs Jeffrey W | $145,000 |
Source: Public Records
Tax History Compared to Growth
Tax History
| Year | Tax Paid | Tax Assessment Tax Assessment Total Assessment is a certain percentage of the fair market value that is determined by local assessors to be the total taxable value of land and additions on the property. | Land | Improvement |
|---|---|---|---|---|
| 2024 | $10,350 | $180,485 | $43,708 | $136,777 |
| 2023 | $10,483 | $180,485 | $43,708 | $136,777 |
| 2022 | $10,327 | $145,394 | $32,634 | $112,760 |
| 2021 | $10,111 | $145,394 | $32,634 | $112,760 |
| 2020 | $9,350 | $145,394 | $32,634 | $112,760 |
| 2019 | $9,049 | $129,816 | $29,138 | $100,678 |
| 2018 | $9,122 | $129,816 | $29,138 | $100,678 |
| 2017 | $8,653 | $129,816 | $29,138 | $100,678 |
| 2016 | $8,607 | $121,734 | $28,557 | $93,177 |
| 2015 | $7,960 | $121,734 | $28,557 | $93,177 |
| 2014 | $8,006 | $121,734 | $28,557 | $93,177 |
| 2013 | $7,912 | $115,934 | $27,195 | $88,739 |
Source: Public Records
Map
Nearby Homes
- 6638 Dawson Rd
- 6860 Dawson Rd
- 6752 Rose Crest Ave
- 7002 Dawson Rd
- 7437 Madeira Pines Dr
- 5995 Crabtree Ln
- 6242 Fulsher Ln
- 7406 Dawson Rd
- 6849 Springcrest Cir
- 6866 Kenwood Rd
- 5880 Crabtree Ln
- 7556 Shawnee Run Rd
- 6887 Kenwood Rd
- 7335 Demar Rd
- 7389 Southside Ave
- 7474 Dawson Rd
- 6947 Euclid Ave
- 7112 Summit Ave
- 6300 Miami Rd
- 5801 Kenwood Rd
- 6700 Shawnee Run Rd
- 6746 Shawnee Run Rd
- 6674 Shawnee Run Rd
- 6770 Shawnee Run Rd
- 6649 Apache Cir
- 6653 Apache Cir
- 6643 Apache Cir
- 6650 Shawnee Run Rd
- 6659 Apache Cir
- 6639 Apache Cir
- 6771 Shawnee Run Rd
- 6715 Shawnee Run Rd
- 6663 Apache Cir
- 6637 Apache Cir
- 6691 Shawnee Run Rd
- 6818 Shawnee Run Rd
- 6626 Shawnee Run Rd
- 6669 Apache Cir
- 6629 Apache Cir
- 6661 Shawnee Run Rd