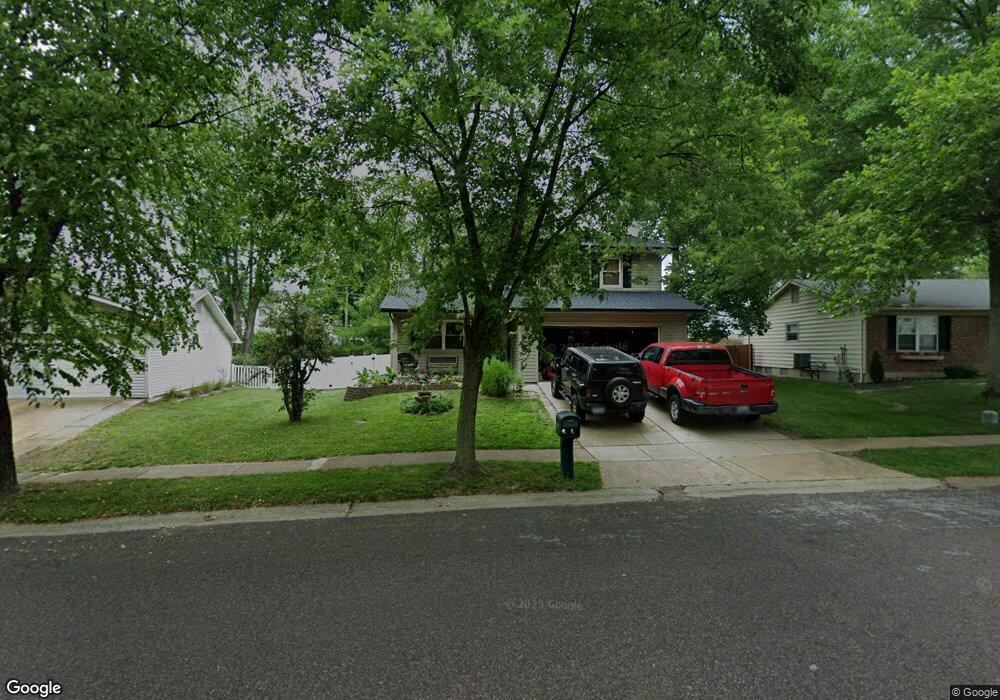
6726 Bear Creek Dr Saint Louis, MO 63129
Estimated Value: $290,000 - $377,000
3
Beds
2
Baths
1,572
Sq Ft
$214/Sq Ft
Est. Value
About This Home
This home is located at 6726 Bear Creek Dr, Saint Louis, MO 63129 and is currently estimated at $337,041, approximately $214 per square foot. 6726 Bear Creek Dr is a home located in St. Louis County with nearby schools including Point Elementary School, Oakville Middle School, and Oakville Senior High School.
Ownership History
Date
Name
Owned For
Owner Type
Purchase Details
Closed on
Jan 10, 2005
Sold by
Coughlin Thomas L and Coughlin Karen L
Bought by
Coughlin Thomas L and Coughlin Karen L
Current Estimated Value
Purchase Details
Closed on
Dec 6, 2004
Sold by
Coughlin Thomas L and Coughlin Karen L
Bought by
Coughlin Thomas L and Coughlin Karen L
Purchase Details
Closed on
Apr 26, 2002
Sold by
Mathews Ralph A and Mathews Rita J
Bought by
Coughlin Thomas L
Home Financials for this Owner
Home Financials are based on the most recent Mortgage that was taken out on this home.
Original Mortgage
$90,000
Outstanding Balance
$37,331
Interest Rate
6.96%
Estimated Equity
$299,710
Purchase Details
Closed on
Feb 21, 1997
Sold by
Jaeger Lois S
Bought by
Mathews Ralph A and Mathews Rita J
Home Financials for this Owner
Home Financials are based on the most recent Mortgage that was taken out on this home.
Original Mortgage
$111,460
Interest Rate
7.92%
Create a Home Valuation Report for This Property
The Home Valuation Report is an in-depth analysis detailing your home's value as well as a comparison with similar homes in the area
Home Values in the Area
Average Home Value in this Area
Purchase History
| Date | Buyer | Sale Price | Title Company |
|---|---|---|---|
| Coughlin Thomas L | -- | -- | |
| Coughlin Thomas L | -- | -- | |
| Coughlin Thomas L | $153,900 | -- | |
| Mathews Ralph A | -- | First American Title Ins Co |
Source: Public Records
Mortgage History
| Date | Status | Borrower | Loan Amount |
|---|---|---|---|
| Open | Coughlin Thomas L | $90,000 | |
| Previous Owner | Mathews Ralph A | $111,460 |
Source: Public Records
Tax History Compared to Growth
Tax History
| Year | Tax Paid | Tax Assessment Tax Assessment Total Assessment is a certain percentage of the fair market value that is determined by local assessors to be the total taxable value of land and additions on the property. | Land | Improvement |
|---|---|---|---|---|
| 2025 | $3,210 | $55,690 | $24,110 | $31,580 |
| 2024 | $3,210 | $47,730 | $12,920 | $34,810 |
| 2023 | $3,210 | $47,730 | $12,920 | $34,810 |
| 2022 | $2,561 | $38,700 | $11,190 | $27,510 |
| 2021 | $2,479 | $38,700 | $11,190 | $27,510 |
| 2020 | $2,624 | $38,990 | $9,460 | $29,530 |
| 2019 | $2,616 | $38,990 | $9,460 | $29,530 |
| 2018 | $2,497 | $33,580 | $8,630 | $24,950 |
| 2017 | $2,493 | $33,580 | $8,630 | $24,950 |
| 2016 | $2,446 | $31,600 | $8,630 | $22,970 |
| 2015 | $2,246 | $31,600 | $8,630 | $22,970 |
| 2014 | -- | $27,720 | $7,620 | $20,100 |
Source: Public Records
Map
Nearby Homes
- 6708 Bear Creek Dr
- 2680 Cripple Creek Dr
- 2995 Point Dr
- 6766 Dry Mill Ct
- 6568 Devonhurst Dr
- 2771 Cliffwood Trail
- 6840 Cottage Grove Ln Unit J
- 6808 Cottage Grove Ln Unit I
- 6834 Black Water Dr
- 6841 River Bow Ct
- 2512 Janel Ct
- 3026 Nettie Dr
- 2692 Queen Bee Ln
- 2581 Christopher Oaks Ct
- 3049 Grassy Valley Dr
- 6221 Water Tower Place Dr
- 7010 Green Tee Ct Unit A
- 6116 Arbor Green Dr
- 3044 Caprock Ct
- 100 River Breeze Way
- 6732 Bear Creek Dr
- 6720 Bear Creek Dr
- 2747 Towne Oaks Dr
- 2751 Towne Oaks Dr
- 6738 Bear Creek Dr
- 2743 Towne Oaks Dr
- 2755 Towne Oaks Dr
- 6714 Bear Creek Dr
- 6727 Bear Creek Dr
- 6721 Bear Creek Dr
- 6744 Bear Creek Dr
- 6739 Bear Creek Dr
- 2739 Towne Oaks Dr
- 2759 Towne Oaks Dr
- 6709 Bear Creek Dr
- 2752 Towne Oaks Dr
- 2811 Bear Creek Ct
- 6750 Bear Creek Dr
- 2748 Towne Oaks Dr
- 2756 Towne Oaks Dr