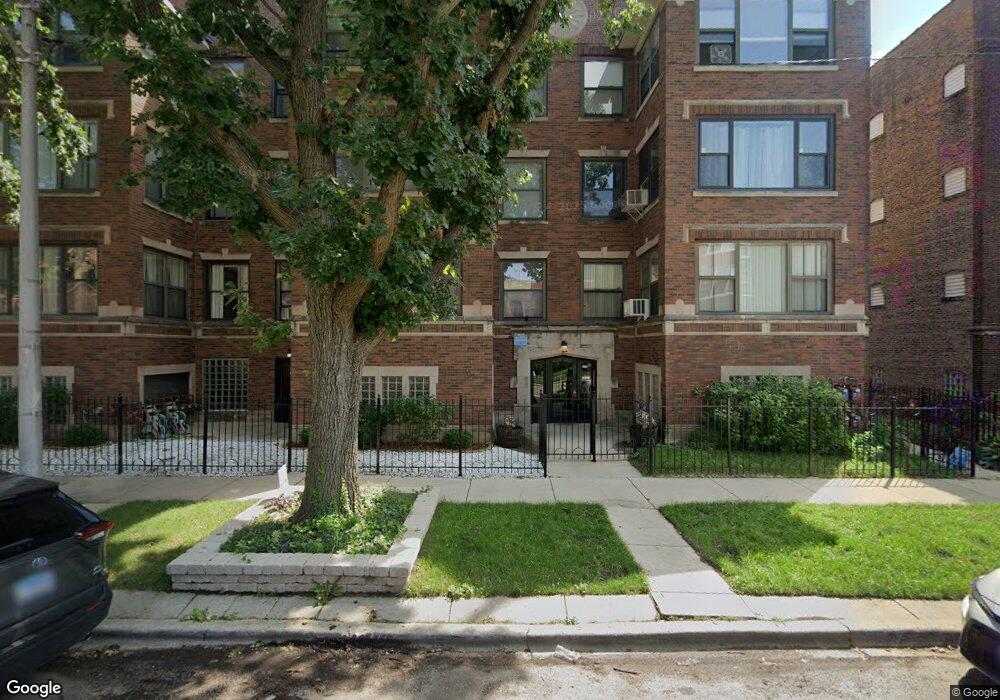
6727 S Merrill Ave Unit 67272 Chicago, IL 60649
South Shore NeighborhoodEstimated Value: $145,493 - $193,000
3
Beds
2
Baths
2,400
Sq Ft
$73/Sq Ft
Est. Value
About This Home
This home is located at 6727 S Merrill Ave Unit 67272, Chicago, IL 60649 and is currently estimated at $176,123, approximately $73 per square foot. 6727 S Merrill Ave Unit 67272 is a home located in Cook County with nearby schools including Okeeffe Elementary School, Hyde Park Academy High School, and St Philip Neri Elementary School.
Ownership History
Date
Name
Owned For
Owner Type
Purchase Details
Closed on
Jul 21, 2020
Sold by
Pelissier Jean
Bought by
Manuel Obregon Harriette E and Harriette E Manuel Obegon Revocable Tr
Current Estimated Value
Purchase Details
Closed on
Feb 15, 2013
Sold by
Federal Home Loan Mortgage Corporation
Bought by
Pelissier Jean
Purchase Details
Closed on
Oct 4, 2012
Sold by
Seay Kyle
Bought by
Federal Home Loan Mortgage Corporation
Purchase Details
Closed on
Dec 29, 1995
Sold by
American National Bk & Tr Co Of Chicago
Bought by
Seay Barbara Ann
Home Financials for this Owner
Home Financials are based on the most recent Mortgage that was taken out on this home.
Original Mortgage
$85,690
Interest Rate
7.41%
Mortgage Type
Purchase Money Mortgage
Create a Home Valuation Report for This Property
The Home Valuation Report is an in-depth analysis detailing your home's value as well as a comparison with similar homes in the area
Home Values in the Area
Average Home Value in this Area
Purchase History
| Date | Buyer | Sale Price | Title Company |
|---|---|---|---|
| Manuel Obregon Harriette E | $120,000 | North American Title Company | |
| Pelissier Jean | $27,500 | First American Title | |
| Federal Home Loan Mortgage Corporation | -- | None Available | |
| Seay Barbara Ann | $89,000 | -- |
Source: Public Records
Mortgage History
| Date | Status | Borrower | Loan Amount |
|---|---|---|---|
| Previous Owner | Seay Barbara Ann | $85,690 |
Source: Public Records
Tax History Compared to Growth
Tax History
| Year | Tax Paid | Tax Assessment Tax Assessment Total Assessment is a certain percentage of the fair market value that is determined by local assessors to be the total taxable value of land and additions on the property. | Land | Improvement |
|---|---|---|---|---|
| 2024 | $1,906 | $17,250 | $1,937 | $15,313 |
| 2023 | $1,851 | $9,000 | $1,562 | $7,438 |
| 2022 | $1,851 | $9,000 | $1,562 | $7,438 |
| 2021 | $1,810 | $8,999 | $1,561 | $7,438 |
| 2020 | $2,619 | $11,757 | $1,561 | $10,196 |
| 2019 | $2,601 | $12,945 | $1,561 | $11,384 |
| 2018 | $2,557 | $12,945 | $1,561 | $11,384 |
| 2017 | $2,647 | $12,298 | $1,374 | $10,924 |
| 2016 | $2,463 | $12,298 | $1,374 | $10,924 |
| 2015 | $2,254 | $12,298 | $1,374 | $10,924 |
| 2014 | $2,590 | $13,958 | $1,124 | $12,834 |
| 2013 | $2,060 | $13,958 | $1,124 | $12,834 |
Source: Public Records
Map
Nearby Homes
- 6727 S Merrill Ave Unit 3
- 6721 S Merrill Ave Unit 1
- 6736 S Merrill Ave Unit 4N
- 2213 E 68th St Unit 1E
- 2221 E 68th St Unit 3
- 6752 S Clyde Ave Unit 3
- 6740 S Oglesby Ave Unit 2
- 2334 E 68th St Unit B
- 6756 S Oglesby Ave Unit 1
- 6836 S Crandon Ave Unit 3
- 2052 E 69th St Unit 1B
- 6843 S Chappel Ave
- 6700 S South Shore Dr Unit 2G
- 6700 S South Shore Dr Unit 10G
- 6700 S South Shore Dr Unit 18K
- 6700 S South Shore Dr Unit 21E
- 6700 S South Shore Dr Unit 17C
- 6700 S South Shore Dr Unit 8A
- 6700 S South Shore Dr Unit 17A
- 6700 S South Shore Dr Unit 25K
- 6727 S Merrill Ave Unit 2
- 6729 S Merrill Ave Unit 67292
- 6727 S Merrill Ave Unit 67271
- 6727 S Merrill Ave Unit 67273
- 6729 S Merrill Ave Unit 67291
- 6729 S Merrill Ave Unit 67293
- 6727 S Merrill Ave Unit 1
- 6729 S Merrill Ave Unit 3
- 6727 S Merrill Ave Unit I
- 6721 S Merrill Ave Unit 67211
- 6721 S Merrill Ave Unit 67213
- 6721 S Merrill Ave Unit 67212
- 6721 S Merrill Ave Unit 2
- 6721 S Merrill Ave Unit 3
- 6719 S Merrill Ave Unit 67191
- 6719 S Merrill Ave Unit 67192
- 6719 S Merrill Ave Unit 67193
- 6719 S Merrill Ave Unit 2
- 6719 S Merrill Ave Unit 1
- 6731 S Merrill Ave