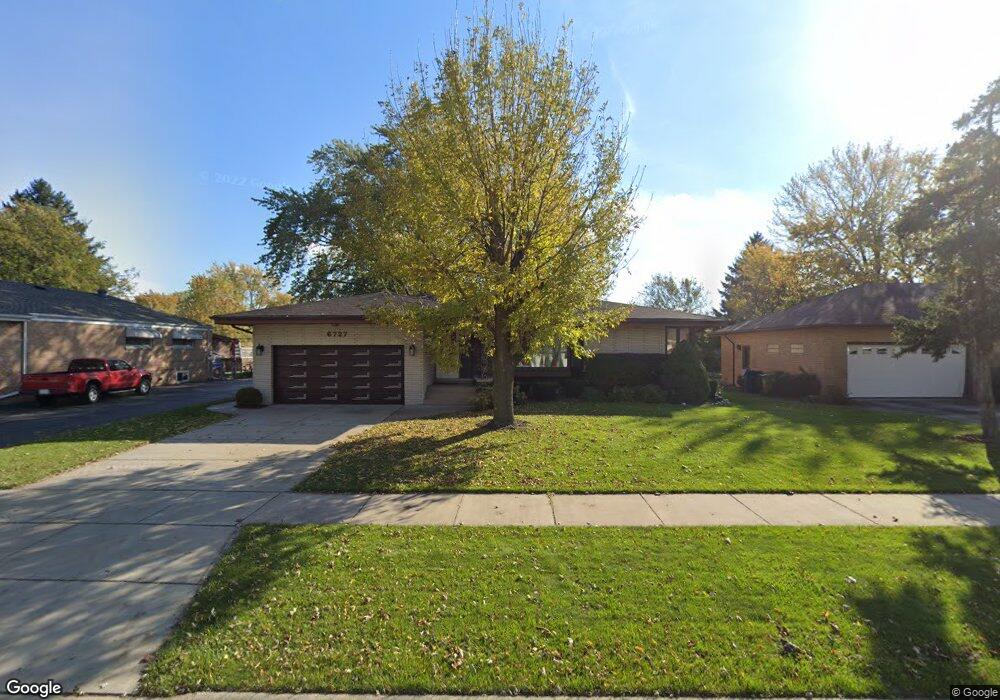
6727 W 88th St Oak Lawn, IL 60453
Estimated Value: $365,325 - $416,000
4
Beds
3
Baths
1,950
Sq Ft
$203/Sq Ft
Est. Value
About This Home
This home is located at 6727 W 88th St, Oak Lawn, IL 60453 and is currently estimated at $396,581, approximately $203 per square foot. 6727 W 88th St is a home located in Cook County with nearby schools including George W Lieb Elementary School, Simmons Middle School, and Oak Lawn Community High School.
Ownership History
Date
Name
Owned For
Owner Type
Purchase Details
Closed on
Oct 7, 2009
Sold by
Korab Kenneth J and Korab Nicole L
Bought by
Korab Kenneth J and Korab Nicole L
Current Estimated Value
Home Financials for this Owner
Home Financials are based on the most recent Mortgage that was taken out on this home.
Original Mortgage
$294,989
Outstanding Balance
$192,918
Interest Rate
5.11%
Mortgage Type
FHA
Estimated Equity
$203,663
Purchase Details
Closed on
Jun 25, 2008
Sold by
Stancik Winifred L
Bought by
Korab Kenneth J and Gray Nicole L
Home Financials for this Owner
Home Financials are based on the most recent Mortgage that was taken out on this home.
Original Mortgage
$290,890
Interest Rate
6.1%
Mortgage Type
FHA
Purchase Details
Closed on
Feb 19, 2003
Sold by
Stancik Winifred L
Bought by
Stancik Winifred L and Ronald M Stancik Family Trust
Create a Home Valuation Report for This Property
The Home Valuation Report is an in-depth analysis detailing your home's value as well as a comparison with similar homes in the area
Home Values in the Area
Average Home Value in this Area
Purchase History
| Date | Buyer | Sale Price | Title Company |
|---|---|---|---|
| Korab Kenneth J | -- | Plymouth Title Guaranty | |
| Korab Kenneth J | $295,000 | Multiple | |
| Stancik Winifred L | -- | -- |
Source: Public Records
Mortgage History
| Date | Status | Borrower | Loan Amount |
|---|---|---|---|
| Open | Korab Kenneth J | $294,989 | |
| Closed | Korab Kenneth J | $290,890 |
Source: Public Records
Tax History Compared to Growth
Tax History
| Year | Tax Paid | Tax Assessment Tax Assessment Total Assessment is a certain percentage of the fair market value that is determined by local assessors to be the total taxable value of land and additions on the property. | Land | Improvement |
|---|---|---|---|---|
| 2024 | $6,730 | $26,477 | $5,756 | $20,721 |
| 2023 | $5,592 | $26,477 | $5,756 | $20,721 |
| 2022 | $5,592 | $19,343 | $5,005 | $14,338 |
| 2021 | $5,450 | $19,343 | $5,005 | $14,338 |
| 2020 | $5,726 | $20,273 | $5,005 | $15,268 |
| 2019 | $5,088 | $19,101 | $4,504 | $14,597 |
| 2018 | $4,874 | $19,101 | $4,504 | $14,597 |
| 2017 | $4,962 | $19,101 | $4,504 | $14,597 |
| 2016 | $5,676 | $19,404 | $3,753 | $15,651 |
| 2015 | $5,591 | $19,404 | $3,753 | $15,651 |
| 2014 | $5,559 | $19,404 | $3,753 | $15,651 |
| 2013 | $5,624 | $21,328 | $3,753 | $17,575 |
Source: Public Records
Map
Nearby Homes
- 8907 Saratoga Dr
- 8912 Windsor Ln
- 6821 Saratoga Dr
- 8937 Fairlane Dr
- 8758 Nashville Ave
- 8632 New England Ave
- 6455 W 88th Place
- 6541 Crescent Ct
- 6442 W 88th St
- 6906 W 91st St
- 8741 Cranbrook Ln
- 8601 Newland Ave
- 6705 W 91st Place
- 9128 Pembroke Ln
- 8700 Ridgeland Ave
- 9108 Crescent Ct
- 9128 Homestead Ln
- 6346 W 90th St
- 9236 Stanford Dr
- 9201 Willow Ln
- 6715 W 88th St
- 6709 W 88th St
- 6739 W 88th St
- 6724 W 88th Place
- 6732 W 88th Place
- 6716 W 88th Place
- 6740 W 88th Place
- 6708 W 88th Place
- 6724 W 88th St
- 6705 W 88th St
- 6745 W 88th St
- 6716 W 88th St
- 6732 W 88th St
- 6704 W 88th St
- 6740 W 88th St
- 6748 W 88th Place
- 6700 W 88th Place
- 6701 W 88th St
- 6755 W 88th St
- 6748 W 88th St