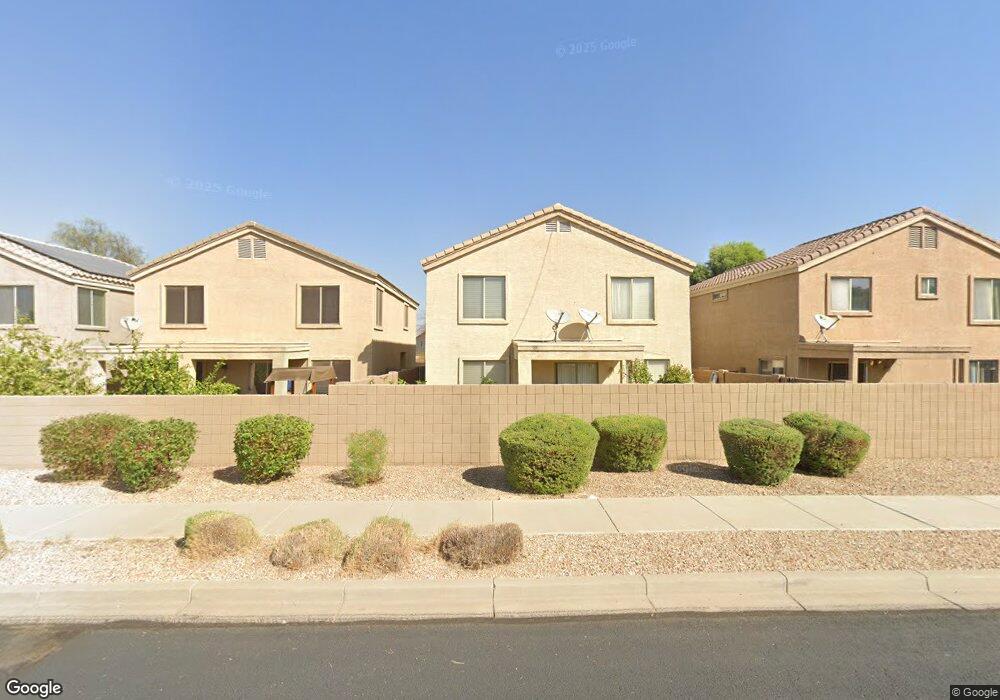
6728 N 130th Ave Glendale, AZ 85307
Estimated Value: $356,860 - $400,000
--
Bed
3
Baths
2,178
Sq Ft
$175/Sq Ft
Est. Value
About This Home
This home is located at 6728 N 130th Ave, Glendale, AZ 85307 and is currently estimated at $381,215, approximately $175 per square foot. 6728 N 130th Ave is a home located in Maricopa County with nearby schools including Barbara B. Robey Elementary School, L. Thomas Heck Middle School, and Canyon View High School.
Ownership History
Date
Name
Owned For
Owner Type
Purchase Details
Closed on
Feb 21, 2020
Sold by
Opendoor Property Trust I
Bought by
Progress Phoenix Llc
Current Estimated Value
Purchase Details
Closed on
Feb 2, 2020
Sold by
Howard Barbara J and Quinn Barbara J
Bought by
Opendoor Property Trust I
Purchase Details
Closed on
May 30, 2006
Sold by
D R Horton Inc Dietz Crane
Bought by
Quinn Barbara J
Home Financials for this Owner
Home Financials are based on the most recent Mortgage that was taken out on this home.
Original Mortgage
$207,736
Interest Rate
6.52%
Mortgage Type
New Conventional
Create a Home Valuation Report for This Property
The Home Valuation Report is an in-depth analysis detailing your home's value as well as a comparison with similar homes in the area
Home Values in the Area
Average Home Value in this Area
Purchase History
| Date | Buyer | Sale Price | Title Company |
|---|---|---|---|
| Progress Phoenix Llc | $230,000 | Fidelity Natl Ttl Agcy Inc | |
| Opendoor Property Trust I | $236,600 | Os National Llc | |
| Quinn Barbara J | $259,670 | Dhi Title Of Arizona Inc |
Source: Public Records
Mortgage History
| Date | Status | Borrower | Loan Amount |
|---|---|---|---|
| Previous Owner | Quinn Barbara J | $207,736 |
Source: Public Records
Tax History Compared to Growth
Tax History
| Year | Tax Paid | Tax Assessment Tax Assessment Total Assessment is a certain percentage of the fair market value that is determined by local assessors to be the total taxable value of land and additions on the property. | Land | Improvement |
|---|---|---|---|---|
| 2025 | $1,631 | $14,213 | -- | -- |
| 2024 | $1,378 | $13,536 | -- | -- |
| 2023 | $1,378 | $26,330 | $5,260 | $21,070 |
| 2022 | $1,375 | $19,930 | $3,980 | $15,950 |
| 2021 | $1,407 | $18,780 | $3,750 | $15,030 |
| 2020 | $1,413 | $16,470 | $3,290 | $13,180 |
| 2019 | $1,180 | $14,700 | $2,940 | $11,760 |
| 2018 | $1,021 | $13,530 | $2,700 | $10,830 |
| 2017 | $961 | $11,920 | $2,380 | $9,540 |
| 2016 | $889 | $11,210 | $2,240 | $8,970 |
| 2015 | $961 | $11,100 | $2,220 | $8,880 |
Source: Public Records
Map
Nearby Homes
- 12929 W Fleetwood Ln
- 12910 W Tuckey Ln
- 6660 N 128th Ln
- 12838 W Tuckey Ln
- 12751 W Ocotillo Rd
- 12727 W Glendale Ave Unit 106
- 13131 W Sierra Vista Dr
- 12668 W Glenn Dr
- 12644 W Glenn Dr
- 13130 W Jacobson Dr
- 12531 W Glenn Dr
- 12652 W Northview Ave
- 12526 W Palmaire Ave
- 6523 N 135th Dr
- 13531 W Tuckey Ct
- 13438 W Rose Ln
- 13532 W Sierra Vista Dr
- 12608 W Gardenia Ave
- 13436 W Peck Dr
- 13420 W Berridge Ln Unit 1
- 6732 N 130th Ave
- 13014 W Lawrence Rd
- 6736 N 130th Ave
- 13018 W Lawrence Rd
- 13007 W Lawrence Rd
- 13011 W Lawrence Rd
- 6804 N 130th Ave
- 6727 N 130th Ave
- 13003 W Lawrence Rd
- 6731 N 130th Ave
- 13022 W Lawrence Rd
- 6723 N 130th Ave
- 6735 N 130th Ave
- 13019 W Lawrence Rd
- 6808 N 130th Ave
- 6805 N 130th Ave
- 13026 W Lawrence Rd
- 13023 W Lawrence Rd
- 13007 W Lamar Rd
- 6803 N 130th Dr