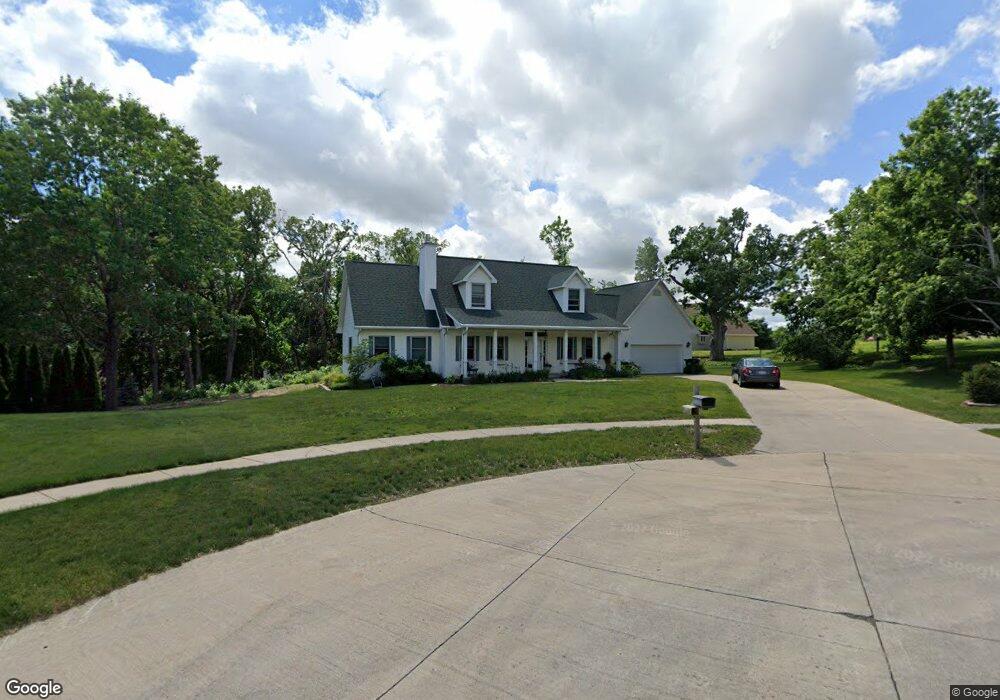
6729 Chippewa Ct NE Cedar Rapids, IA 52411
Estimated Value: $394,000 - $453,000
3
Beds
3
Baths
2,321
Sq Ft
$179/Sq Ft
Est. Value
About This Home
This home is located at 6729 Chippewa Ct NE, Cedar Rapids, IA 52411 and is currently estimated at $415,605, approximately $179 per square foot. 6729 Chippewa Ct NE is a home located in Linn County with nearby schools including Maple Grove Elementary School, North Middletown Elementary School, and Ponderosa Elementary School.
Ownership History
Date
Name
Owned For
Owner Type
Purchase Details
Closed on
Jul 1, 2005
Sold by
Hedlund Lawrence R
Bought by
Wheaton Allyson L
Current Estimated Value
Purchase Details
Closed on
Dec 13, 2000
Sold by
Dyer Sattler Partnership
Bought by
Jim Sattler Construction Co Inc
Create a Home Valuation Report for This Property
The Home Valuation Report is an in-depth analysis detailing your home's value as well as a comparison with similar homes in the area
Home Values in the Area
Average Home Value in this Area
Purchase History
| Date | Buyer | Sale Price | Title Company |
|---|---|---|---|
| Wheaton Allyson L | -- | -- | |
| Jim Sattler Construction Co Inc | -- | -- |
Source: Public Records
Tax History Compared to Growth
Tax History
| Year | Tax Paid | Tax Assessment Tax Assessment Total Assessment is a certain percentage of the fair market value that is determined by local assessors to be the total taxable value of land and additions on the property. | Land | Improvement |
|---|---|---|---|---|
| 2025 | $5,772 | $353,900 | $73,700 | $280,200 |
| 2024 | $5,704 | $336,600 | $73,700 | $262,900 |
| 2023 | $5,704 | $336,600 | $73,700 | $262,900 |
| 2022 | $5,368 | $279,300 | $65,900 | $213,400 |
| 2021 | $5,262 | $268,100 | $65,900 | $202,200 |
| 2020 | $5,262 | $247,100 | $65,900 | $181,200 |
| 2019 | $5,334 | $256,000 | $54,300 | $201,700 |
| 2018 | $5,182 | $256,000 | $54,300 | $201,700 |
| 2017 | $5,318 | $252,700 | $54,300 | $198,400 |
| 2016 | $5,151 | $242,300 | $54,300 | $188,000 |
| 2015 | $5,517 | $259,270 | $46,539 | $212,731 |
| 2014 | $5,332 | $259,270 | $46,539 | $212,731 |
| 2013 | $5,214 | $259,270 | $46,539 | $212,731 |
Source: Public Records
Map
Nearby Homes
- 6910 Kiowa Trace NE
- 5801 Seminole Valley Trail NE
- 5413 Seminole Valley Trail NE
- 5428 Seminole Valley Trail NE
- 5624 Seminole Valley Trail NE
- 5300 Seminole Valley Trail NE
- 5408 Seminole Valley Trail NE
- 3400 Cedar River Ct NE
- 5820 Seminole Valley Trail NE
- 5814 Seminole Valley Trail NE
- 5808 Seminole Valley Trail NE
- 5802 Seminole Valley Trail NE
- 5727 Seminole Valley Trail NE
- 6712 Spring Grove Ct NE
- 5434 Seminole Valley Trail NE
- 5506 Seminole Valley Trail NE
- 5402 Seminole Valley Trail NE
- 5407 Seminole Valley Trail NE
- 5419 Seminole Valley Trl Ne - New Build
- 5419 Seminole Valley Trl Ne-New Build
- 6811 Crow Wing Dr NE
- 6717 Chippewa Ct NE
- 6730 Chippewa Ct NE
- 6800 Kiowa Trace NE
- 6814 Crow Wing Dr NE
- 6724 Kiowa Trace NE
- 6814 Kiowa Trace NE
- 6814 Kiowa Trace NE
- 6716 Chippewa Ct NE
- 6825 Crow Wing Dr NE
- 6705 Chippewa Ct NE
- 6704 Kiowa Trace NE
- 6828 Crow Wing Dr NE
- 6820 Kiowa Trace NE
- 6820 Kiowa Trace NE
- 6704 Chippewa Ct NE
- 6801 Deer Horn Trail NE
- 6839 Crow Wing Dr NE
- 6725 Deer Horn Trail NE
- 6815 Deer Horn Trail NE