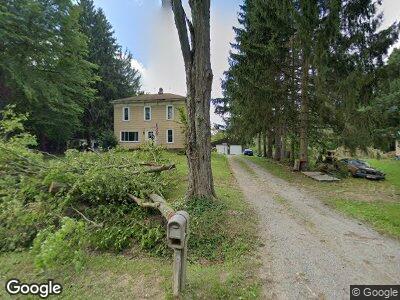
6729 Pymatuning Lake Rd Andover, OH 44003
Estimated Value: $160,000 - $250,000
5
Beds
2
Baths
1,974
Sq Ft
$105/Sq Ft
Est. Value
About This Home
This home is located at 6729 Pymatuning Lake Rd, Andover, OH 44003 and is currently estimated at $207,399, approximately $105 per square foot. 6729 Pymatuning Lake Rd is a home located in Ashtabula County with nearby schools including Pymatuning Valley Primary School, Pymatuning Valley Middle School, and Pymatuning Valley High School.
Ownership History
Date
Name
Owned For
Owner Type
Purchase Details
Closed on
May 15, 2017
Sold by
Bettcher David K and Bettcher Matthew
Bought by
Dismukes Darryl and Dismukes Darryl M
Current Estimated Value
Home Financials for this Owner
Home Financials are based on the most recent Mortgage that was taken out on this home.
Original Mortgage
$73,000
Outstanding Balance
$61,633
Interest Rate
4.14%
Mortgage Type
New Conventional
Estimated Equity
$145,738
Purchase Details
Closed on
Mar 23, 2011
Sold by
Bettcher David K
Bought by
Dismukes Darryl
Home Financials for this Owner
Home Financials are based on the most recent Mortgage that was taken out on this home.
Original Mortgage
$89,300
Interest Rate
5.09%
Mortgage Type
Seller Take Back
Purchase Details
Closed on
Jan 6, 2011
Sold by
Bettcher Mary E
Bought by
Bettcher David K
Create a Home Valuation Report for This Property
The Home Valuation Report is an in-depth analysis detailing your home's value as well as a comparison with similar homes in the area
Home Values in the Area
Average Home Value in this Area
Purchase History
| Date | Buyer | Sale Price | Title Company |
|---|---|---|---|
| Dismukes Darryl | $100,000 | Chicago Title | |
| Dismukes Darryl | $100,000 | Attorney | |
| Bettcher David K | -- | Attorney |
Source: Public Records
Mortgage History
| Date | Status | Borrower | Loan Amount |
|---|---|---|---|
| Open | Dismukes Darryl | $21,000 | |
| Open | Dismukes Darryl | $73,000 | |
| Previous Owner | Dismukes Darryl | $89,300 | |
| Previous Owner | Bettcher David K | $25,000 | |
| Previous Owner | Bettcher David K | $72,000 |
Source: Public Records
Tax History Compared to Growth
Tax History
| Year | Tax Paid | Tax Assessment Tax Assessment Total Assessment is a certain percentage of the fair market value that is determined by local assessors to be the total taxable value of land and additions on the property. | Land | Improvement |
|---|---|---|---|---|
| 2024 | $2,896 | $47,390 | $4,200 | $43,190 |
| 2023 | $2,001 | $47,390 | $4,200 | $43,190 |
| 2022 | $1,514 | $34,090 | $3,220 | $30,870 |
| 2021 | $1,581 | $34,090 | $3,220 | $30,870 |
| 2020 | $1,582 | $34,090 | $3,220 | $30,870 |
| 2019 | $1,548 | $32,380 | $3,640 | $28,740 |
| 2018 | $1,499 | $32,380 | $3,640 | $28,740 |
| 2017 | $1,481 | $32,380 | $3,640 | $28,740 |
| 2016 | $1,397 | $30,280 | $3,400 | $26,880 |
| 2015 | $1,402 | $30,280 | $3,400 | $26,880 |
| 2014 | $1,341 | $30,280 | $3,400 | $26,880 |
| 2013 | $1,087 | $23,280 | $2,630 | $20,650 |
Source: Public Records
Map
Nearby Homes
- 0000 Williams Ave
- 5940 Elm St
- 6790 Slater Rd
- 1035 Winding Way
- 875 Hillside Rd
- 1358 Lakeview Rd
- 1059 Clover Ln
- 1429 Quick Dr
- 6823 Pyma Dr
- 00 Penn Rd
- 7005 North Dr
- 00 Penn Rd
- 1568 Quick Rd
- 1597 Lakeview Rd
- 7823 Lakewood Dr
- 7833 Pymatuning Lake Rd
- VL Martin Dr
- VL Martin Dr
- 9185 Reigleman Dr
- 8766 Quaker Ln
- 6729 Pymatuning Lake Rd
- 6737 Pymatuning Lake Rd
- 6919 Pymatuning Lake Rd
- 7010 N Clubside Dr
- 6907 Pymatuning Lake Rd
- 7000 N Clubside Dr
- 7000 N Clubside Dr Unit 99
- 6999 N Clubside Dr
- 7008 N Clubside Dr
- 7008 Morningview Dr
- 6988 N Clubside Dr
- 7000 Morningview Dr
- 6677 Pymatuning Lake Rd
- 6979 N Clubside Dr
- 6763 Pymatuning Lake Rd
- 6643 Pymatuning Lake Rd
- 7013 Morningview Dr
- 7021 Morningview Dr
- 6968 Morningview Dr
- 000 Morningview Dr