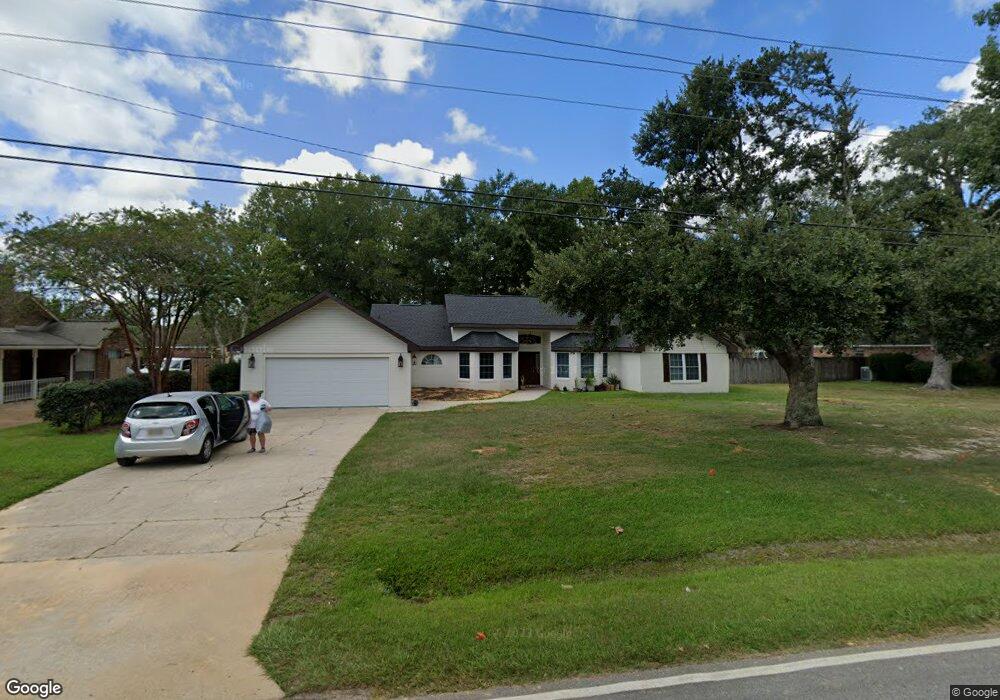
6729 Riviera Dr Biloxi, MS 39532
Estimated Value: $229,456 - $304,000
Studio
2
Baths
1,927
Sq Ft
$134/Sq Ft
Est. Value
About This Home
This home is located at 6729 Riviera Dr, Biloxi, MS 39532 and is currently estimated at $258,614, approximately $134 per square foot. 6729 Riviera Dr is a home located in Jackson County with nearby schools including St Martin North Elementary School, St Martin East Elementary School, and St Martin Upper Elementary School.
Ownership History
Date
Name
Owned For
Owner Type
Purchase Details
Closed on
May 30, 2023
Sold by
Dina Properties Llc
Bought by
Dina Properties Llc
Current Estimated Value
Purchase Details
Closed on
Mar 22, 2021
Sold by
Southern Props United Llc
Bought by
Dina Properties Llc
Home Financials for this Owner
Home Financials are based on the most recent Mortgage that was taken out on this home.
Original Mortgage
$120,810
Interest Rate
2.73%
Mortgage Type
Purchase Money Mortgage
Purchase Details
Closed on
Feb 22, 2021
Sold by
Taylor Linda A
Bought by
Southern Props United Llc
Home Financials for this Owner
Home Financials are based on the most recent Mortgage that was taken out on this home.
Original Mortgage
$120,810
Interest Rate
2.73%
Mortgage Type
Purchase Money Mortgage
Purchase Details
Closed on
Aug 8, 2019
Sold by
Taylor Linda A
Bought by
Taylor Linda A
Create a Home Valuation Report for This Property
The Home Valuation Report is an in-depth analysis detailing your home's value as well as a comparison with similar homes in the area
Home Values in the Area
Average Home Value in this Area
Purchase History
| Date | Buyer | Sale Price | Title Company |
|---|---|---|---|
| Dina Properties Llc | -- | None Listed On Document | |
| Dina Properties Llc | -- | None Available | |
| Southern Props United Llc | -- | None Available | |
| Taylor Linda A | -- | -- |
Source: Public Records
Mortgage History
| Date | Status | Borrower | Loan Amount |
|---|---|---|---|
| Previous Owner | Dina Properties Llc | $120,810 |
Source: Public Records
Tax History
| Year | Tax Paid | Tax Assessment Tax Assessment Total Assessment is a certain percentage of the fair market value that is determined by local assessors to be the total taxable value of land and additions on the property. | Land | Improvement |
|---|---|---|---|---|
| 2025 | $2,603 | $21,611 | $1,868 | $19,743 |
| 2024 | $2,603 | $20,686 | $1,811 | $18,875 |
| 2023 | $2,521 | $20,686 | $1,811 | $18,875 |
| 2022 | $2,453 | $20,686 | $1,811 | $18,875 |
| 2021 | $2,451 | $20,663 | $1,811 | $18,852 |
| 2020 | $2,398 | $19,466 | $1,877 | $17,589 |
| 2019 | $668 | $12,977 | $1,251 | $11,726 |
| 2018 | $680 | $12,977 | $1,251 | $11,726 |
| 2017 | $684 | $12,917 | $1,251 | $11,666 |
| 2016 | $663 | $12,963 | $1,942 | $11,021 |
| 2015 | $491 | $115,200 | $21,020 | $94,180 |
| 2014 | $524 | $11,869 | $2,102 | $9,767 |
| 2013 | $507 | $11,869 | $2,102 | $9,767 |
Source: Public Records
Map
Nearby Homes
- 6816 Southwind Dr
- 0 Riviera Dr Unit 4132630
- 6600 Martinique Dr
- 6704 Martinque Dr
- 6608 Riviera Dr
- 14812 Dismuke Ave
- 0 Dr
- 0 Riviera -Parcel 2 Unit 4132700
- 15000 Hummingbird Ln
- 6200 Riviera Dr
- 14808 Dismuke Dr
- 15311 Dismuke Dr
- 6209 Riviera Dr
- 6401 Ascot Dr
- 6101 Crescent Shore Dr
- 6010 Crescent Shore Dr
- 0 Crescent Shore Dr
- 6103 Crescent Shore Dr
- 6010 & No Crescent Shore Dr
- 6313 Hermosa Dr
- 6733 Riviera Dr
- No Porteaux Bay and Riviera Dr
- 6809 Riviera Dr
- 6733 Riviera Dr
- 14704 Rue Mornay
- 6812 Rue Mornay N
- 6808 Rue Mornay N
- 6819 Rue Mornay N
- 14629 Porteaux Bay Dr
- 14708 Rue Mornay
- 6737 Riviera Dr
- 6728 Riviera Dr
- 14632 Porteaux Bay Dr
- 14701 Rue Mornay
- 14705 Rue Mornay
- 14628 Porteaux Bay Dr
- 6724 Riviera Dr
- 6741 Riviera Dr
- 6741 Riviera Dr
- 14709 Rue Mornay
Your Personal Tour Guide
Ask me questions while you tour the home.