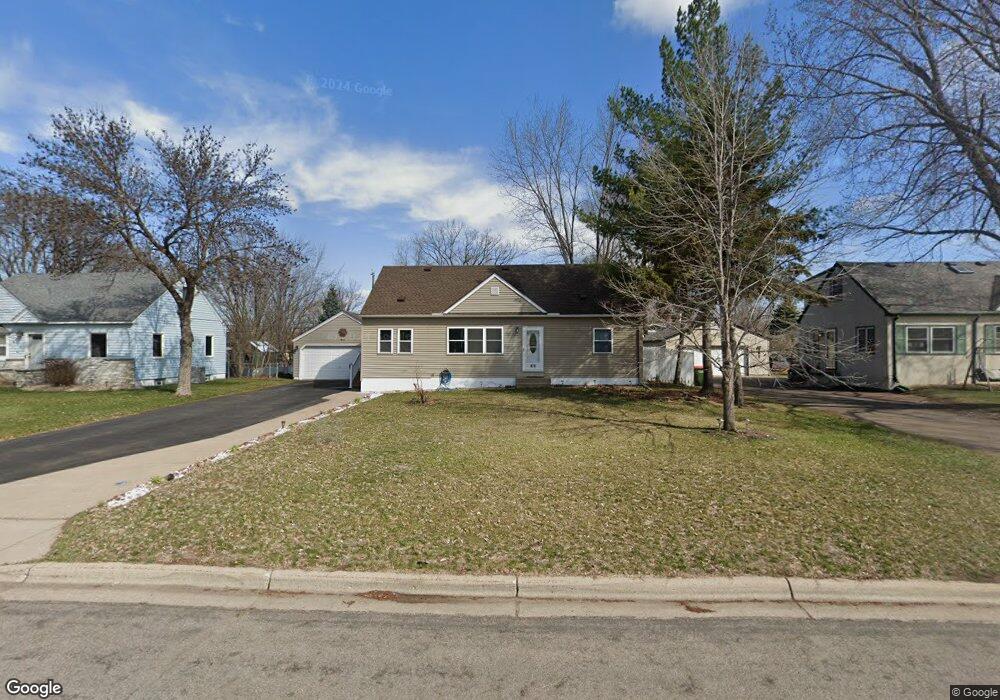
673 Ballantyne Ln NE Minneapolis, MN 55432
Estimated Value: $334,362 - $361,000
5
Beds
2
Baths
1,840
Sq Ft
$189/Sq Ft
Est. Value
About This Home
This home is located at 673 Ballantyne Ln NE, Minneapolis, MN 55432 and is currently estimated at $348,591, approximately $189 per square foot. 673 Ballantyne Ln NE is a home located in Anoka County with nearby schools including Park Terrace Elementary School, Westwood Intermediate and Middle School, and Grace Lutheran School.
Ownership History
Date
Name
Owned For
Owner Type
Purchase Details
Closed on
May 17, 2017
Sold by
Blanski Lori
Bought by
Torres Hugo A Martinez and Saaverdra Yanet Ortiz
Current Estimated Value
Home Financials for this Owner
Home Financials are based on the most recent Mortgage that was taken out on this home.
Original Mortgage
$10,000
Outstanding Balance
$8,286
Interest Rate
3.97%
Mortgage Type
Second Mortgage Made To Cover Down Payment
Estimated Equity
$340,305
Purchase Details
Closed on
Mar 17, 2010
Sold by
Deutsche Bank National Trust Co
Bought by
Blanski Lori
Home Financials for this Owner
Home Financials are based on the most recent Mortgage that was taken out on this home.
Original Mortgage
$132,050
Interest Rate
5.02%
Mortgage Type
New Conventional
Purchase Details
Closed on
Nov 13, 1997
Sold by
Schimmelman William Richard and Schimmelman Janine Gail
Bought by
Allen Andrew G and Allen Kristine F
Create a Home Valuation Report for This Property
The Home Valuation Report is an in-depth analysis detailing your home's value as well as a comparison with similar homes in the area
Home Values in the Area
Average Home Value in this Area
Purchase History
| Date | Buyer | Sale Price | Title Company |
|---|---|---|---|
| Torres Hugo A Martinez | $232,000 | Titlesmart Inc | |
| Blanski Lori | $132,050 | -- | |
| Allen Andrew G | $102,500 | -- |
Source: Public Records
Mortgage History
| Date | Status | Borrower | Loan Amount |
|---|---|---|---|
| Open | Torres Hugo A Martinez | $10,000 | |
| Open | Torres Hugo A Martinez | $227,797 | |
| Previous Owner | Blanski Lori | $132,050 |
Source: Public Records
Tax History Compared to Growth
Tax History
| Year | Tax Paid | Tax Assessment Tax Assessment Total Assessment is a certain percentage of the fair market value that is determined by local assessors to be the total taxable value of land and additions on the property. | Land | Improvement |
|---|---|---|---|---|
| 2025 | $3,137 | $283,000 | $64,500 | $218,500 |
| 2024 | $3,137 | $278,500 | $58,600 | $219,900 |
| 2023 | $3,107 | $300,600 | $70,600 | $230,000 |
| 2022 | $2,982 | $299,700 | $58,000 | $241,700 |
| 2021 | $2,813 | $242,400 | $48,300 | $194,100 |
| 2020 | $2,993 | $229,900 | $51,900 | $178,000 |
| 2019 | $2,743 | $229,700 | $56,600 | $173,100 |
| 2018 | $2,507 | $207,800 | $0 | $0 |
| 2017 | $2,453 | $182,200 | $0 | $0 |
| 2016 | $2,177 | $156,400 | $0 | $0 |
| 2015 | $2,072 | $156,400 | $48,200 | $108,200 |
| 2014 | -- | $141,100 | $47,500 | $93,600 |
Source: Public Records
Map
Nearby Homes
- 644 82nd Ave NE
- 8032 Madison St NE
- 757 81st Ave NE
- 657 79th Ave NE
- 601 79th Ave NE
- 516 84th Ave NE
- 795 84th Ave NE
- 7811 Jackson St NE
- 8157 Taylor St NE
- 8132 Fillmore St NE
- 803 Manor Dr NE
- 7717 Able St NE
- 881 Manor Dr NE
- 1240 80th Ave NE
- 1270 80th Ave NE
- 1010 North Cir NE
- 8663 Van Buren St NE
- 7446 Oakley St NE Unit D446
- 8662 Polk St NE
- 7324 West Cir NE Unit K324
- 687 Ballantyne Ln NE
- 659 Ballantyne Ln NE
- 672 82nd Ave NE
- 686 82nd Ave NE
- 699 Ballantyne Ln NE
- 645 Ballantyne Ln NE
- 658 82nd Ave NE
- 686 Ballantyne Ln NE
- 690 82nd Ave NE
- 698 Ballantyne Ln NE
- 631 Ballantyne Ln NE
- 644 Ballantyne Ln NE
- 630 82nd Ave NE
- 630 Ballantyne Ln NE
- 701 Ballantyne Ln NE
- 617 Ballantyne Ln NE
- 673 81st Ave NE
- 659 81st Ave NE
- 687 81st Ave NE
- 673 82nd Ave NE