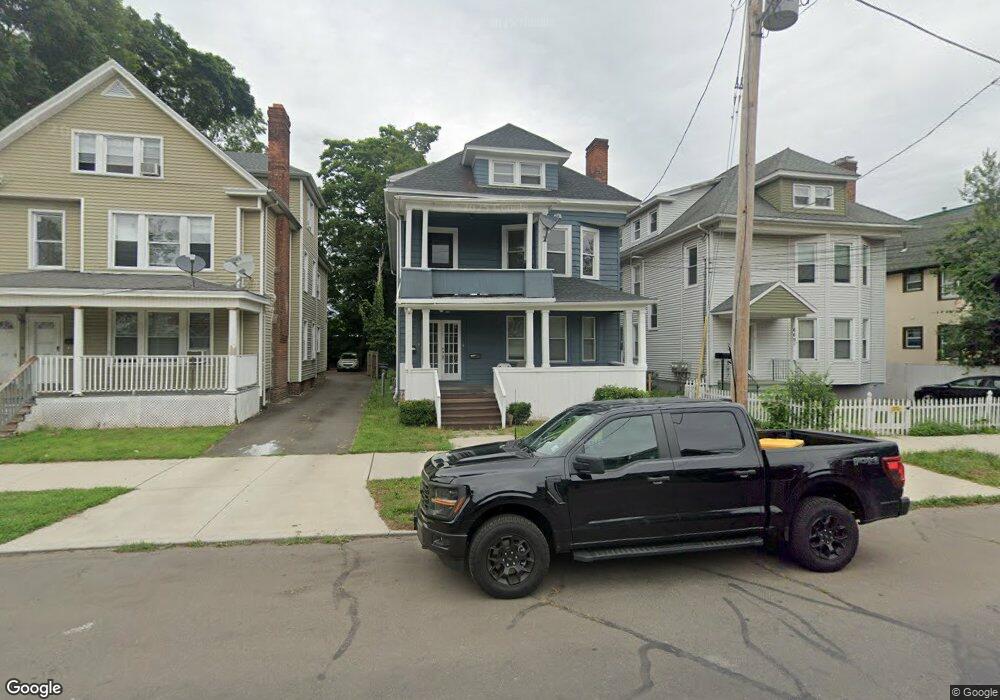
673 Elm St New Haven, CT 06511
Edgewood NeighborhoodEstimated Value: $579,000 - $645,000
8
Beds
3
Baths
3,935
Sq Ft
$155/Sq Ft
Est. Value
About This Home
This home is located at 673 Elm St, New Haven, CT 06511 and is currently estimated at $611,333, approximately $155 per square foot. 673 Elm St is a home located in New Haven County with nearby schools including Amistad Academy and Yeshiva Gedolah Rabbinical Inst.
Ownership History
Date
Name
Owned For
Owner Type
Purchase Details
Closed on
Sep 12, 2023
Sold by
Bdg Llc
Bought by
Kirkland Earnestine B
Current Estimated Value
Purchase Details
Closed on
Aug 7, 2023
Sold by
Bdg Llc
Bought by
Kirkland Earnestine B
Purchase Details
Closed on
Mar 5, 2019
Sold by
Kirkland Earnestine B
Bought by
Bdg Llc
Purchase Details
Closed on
Jun 26, 1975
Bought by
Kirkland Grady W and Kirkland Earnestine
Create a Home Valuation Report for This Property
The Home Valuation Report is an in-depth analysis detailing your home's value as well as a comparison with similar homes in the area
Home Values in the Area
Average Home Value in this Area
Purchase History
| Date | Buyer | Sale Price | Title Company |
|---|---|---|---|
| Kirkland Earnestine B | -- | None Available | |
| Kirkland Earnestine B | -- | None Available | |
| Bdg Llc | -- | -- | |
| Kirkland Grady W | $38,700 | -- |
Source: Public Records
Tax History Compared to Growth
Tax History
| Year | Tax Paid | Tax Assessment Tax Assessment Total Assessment is a certain percentage of the fair market value that is determined by local assessors to be the total taxable value of land and additions on the property. | Land | Improvement |
|---|---|---|---|---|
| 2025 | $9,294 | $235,900 | $47,950 | $187,950 |
| 2024 | $9,082 | $235,900 | $47,950 | $187,950 |
| 2023 | $8,775 | $235,900 | $47,950 | $187,950 |
| 2022 | $9,377 | $235,900 | $47,950 | $187,950 |
| 2021 | $6,727 | $153,300 | $41,370 | $111,930 |
| 2020 | $6,727 | $153,300 | $41,370 | $111,930 |
| 2019 | $6,589 | $153,300 | $41,370 | $111,930 |
| 2018 | $6,589 | $153,300 | $41,370 | $111,930 |
| 2017 | $5,930 | $153,300 | $41,370 | $111,930 |
| 2016 | $5,070 | $122,010 | $32,480 | $89,530 |
| 2015 | $5,070 | $122,010 | $32,480 | $89,530 |
| 2014 | $5,070 | $122,010 | $32,480 | $89,530 |
Source: Public Records
Map
Nearby Homes