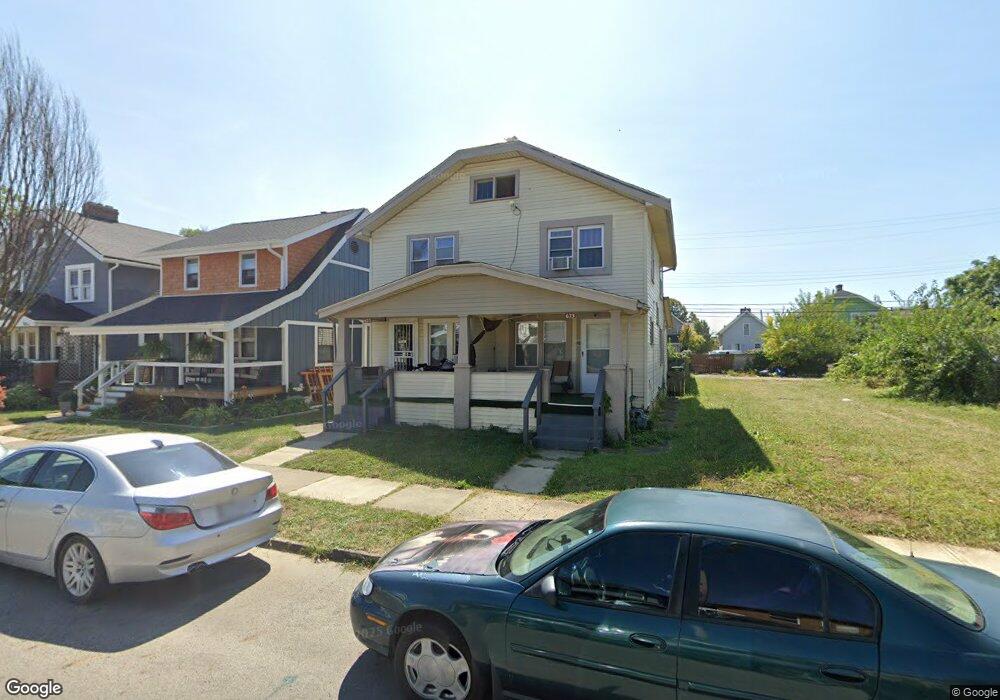
673 Hanford St Unit 675 Columbus, OH 43206
Karns Park NeighborhoodEstimated Value: $116,000 - $272,000
4
Beds
2
Baths
1,880
Sq Ft
$120/Sq Ft
Est. Value
About This Home
This home is located at 673 Hanford St Unit 675, Columbus, OH 43206 and is currently estimated at $225,831, approximately $120 per square foot. 673 Hanford St Unit 675 is a home located in Franklin County with nearby schools including Lincoln Park Elementary School, South High School, and St Pauls Lutheran School.
Ownership History
Date
Name
Owned For
Owner Type
Purchase Details
Closed on
Mar 21, 2022
Sold by
Jean Louis Parisa
Bought by
Louis Rosmy Jean
Current Estimated Value
Purchase Details
Closed on
Dec 18, 2020
Sold by
Jean Louis Parisa
Bought by
Louis Rosmy Jean
Purchase Details
Closed on
Jul 27, 2010
Sold by
Jean Louis Rosmy and Jean Louis Parisa
Bought by
Jean Louis Rosmy Jean and Jean Louis Parisa
Purchase Details
Closed on
Jun 17, 2010
Sold by
Kimmerle Cash C
Bought by
Jean Louis Rosmy Jean and Jean Louis Parisa
Purchase Details
Closed on
Sep 5, 1997
Sold by
Lapolla Thomas A
Bought by
Kimmerle Cash C
Home Financials for this Owner
Home Financials are based on the most recent Mortgage that was taken out on this home.
Original Mortgage
$81,156
Interest Rate
7.44%
Mortgage Type
VA
Purchase Details
Closed on
Aug 3, 1990
Create a Home Valuation Report for This Property
The Home Valuation Report is an in-depth analysis detailing your home's value as well as a comparison with similar homes in the area
Home Values in the Area
Average Home Value in this Area
Purchase History
| Date | Buyer | Sale Price | Title Company |
|---|---|---|---|
| Louis Rosmy Jean | -- | Meyer Carl J | |
| Louis Rosmy Jean | -- | Meyer Carl J | |
| Jean Louis Rosmy Jean | $14,800 | Tlc Title | |
| Jean Louis Rosmy Jean | $28,000 | Tlc Title | |
| Kimmerle Cash C | $79,600 | Title First Agency Inc | |
| -- | $59,900 | -- |
Source: Public Records
Mortgage History
| Date | Status | Borrower | Loan Amount |
|---|---|---|---|
| Previous Owner | Kimmerle Cash C | $81,156 |
Source: Public Records
Tax History Compared to Growth
Tax History
| Year | Tax Paid | Tax Assessment Tax Assessment Total Assessment is a certain percentage of the fair market value that is determined by local assessors to be the total taxable value of land and additions on the property. | Land | Improvement |
|---|---|---|---|---|
| 2024 | $6,704 | $76,970 | $20,720 | $56,250 |
| 2023 | $3,633 | $76,970 | $20,720 | $56,250 |
| 2022 | $1,228 | $23,100 | $4,620 | $18,480 |
| 2021 | $1,380 | $23,100 | $4,620 | $18,480 |
| 2020 | $1,382 | $23,100 | $4,620 | $18,480 |
| 2019 | $1,347 | $19,250 | $3,850 | $15,400 |
| 2018 | $1,393 | $19,250 | $3,850 | $15,400 |
| 2017 | $1,484 | $21,560 | $3,850 | $17,710 |
| 2016 | $1,577 | $22,480 | $3,610 | $18,870 |
| 2015 | $1,440 | $22,480 | $3,610 | $18,870 |
| 2014 | $1,394 | $22,480 | $3,610 | $18,870 |
| 2013 | $723 | $23,625 | $3,780 | $19,845 |
Source: Public Records
Map
Nearby Homes
- 706 Frebis Ave
- 721 Hanford St Unit 721-723
- 676 E Moler St
- 621-627 E Gates St
- 609 Frebis Ave
- 605 Frebis Ave
- 0 Gilbert St
- 735-737 E Mithoff St
- 601 Frebis Ave
- 656 Sheldon Ave
- 650 E Mithoff St
- 554 Hanford St
- 1263 Heyl Ave
- 693 Thurman Ave
- 563 Frebis Ave
- 739 Thurman Ave
- 798 E Mithoff St
- 546 Frebis Ave
- 523 Hanford St
- 1240 S 17th St
- 673-675 Hanford St
- 677 Hanford St
- 667-669 Hanford St Unit 69
- 667-669 Hanford St
- 667 Hanford St Unit 669
- 681 Hanford St Unit 683
- 665 Hanford St
- 659-661 Hanford St
- 659 Hanford St Unit 661
- 661 Hanford St
- 676 Hanford St
- 688 Frebis Ave
- 688 Frebis Ave
- 655 Hanford St
- 694 Frebis Ave Unit 696
- 682 Frebis Ave Unit 684
- 694-696 Frebis Ave
- 695 Hanford St
- 674 Hanford St Unit 676
- 678 Hanford St Unit 680