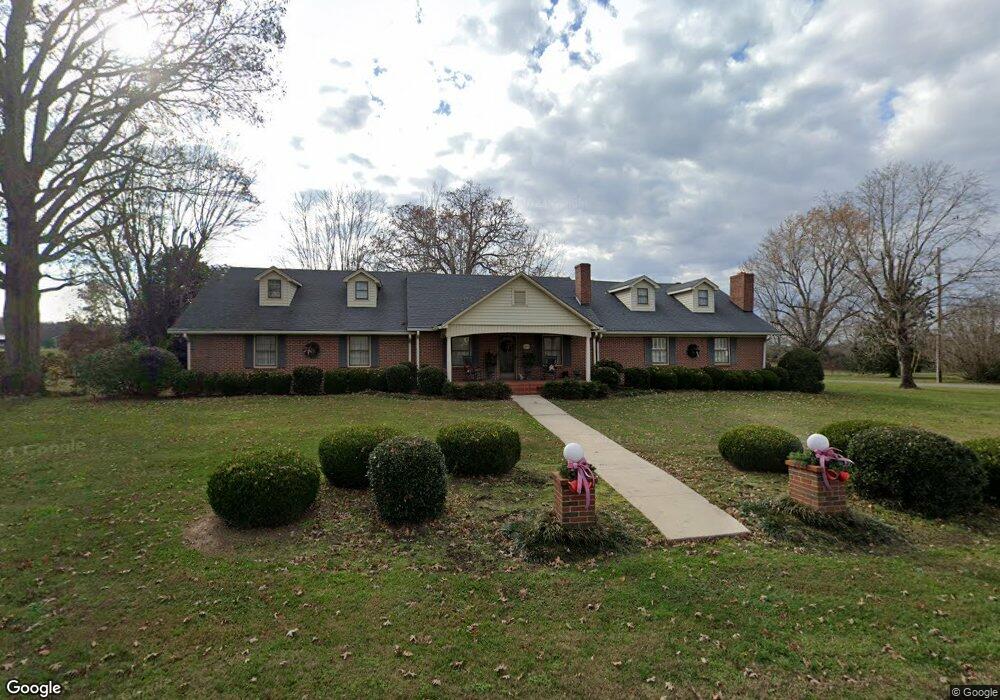
673 Locust Grove Rd Cookeville, TN 38501
Estimated Value: $941,000 - $1,641,000
--
Bed
4
Baths
5,672
Sq Ft
$228/Sq Ft
Est. Value
About This Home
This home is located at 673 Locust Grove Rd, Cookeville, TN 38501 and is currently estimated at $1,294,951, approximately $228 per square foot. 673 Locust Grove Rd is a home located in Putnam County with nearby schools including Cane Creek Elementary School, Upperman Middle School, and Upperman High School.
Ownership History
Date
Name
Owned For
Owner Type
Purchase Details
Closed on
May 11, 2016
Sold by
Gaw Oscar W
Bought by
Turnbow James Byron Christina
Current Estimated Value
Home Financials for this Owner
Home Financials are based on the most recent Mortgage that was taken out on this home.
Original Mortgage
$500,000
Interest Rate
3.58%
Mortgage Type
New Conventional
Purchase Details
Closed on
Dec 31, 2012
Sold by
Gaw Oscar W
Bought by
Gaw Monte and Peace Shawna K Gaw
Purchase Details
Closed on
Jun 2, 2000
Sold by
Roussel Investments Lp
Bought by
Hassler Lloyd R
Purchase Details
Closed on
Jun 1, 2000
Sold by
Roussel Investments Lp
Bought by
Roussel Investments Lp
Purchase Details
Closed on
Aug 2, 1972
Bought by
Gaw Oscar W and Betty Sue
Purchase Details
Closed on
Aug 1, 1972
Bought by
Gaw Oscar W and Betty Sue
Purchase Details
Closed on
Oct 18, 1971
Purchase Details
Closed on
Dec 3, 1970
Purchase Details
Closed on
Oct 19, 1967
Create a Home Valuation Report for This Property
The Home Valuation Report is an in-depth analysis detailing your home's value as well as a comparison with similar homes in the area
Home Values in the Area
Average Home Value in this Area
Purchase History
| Date | Buyer | Sale Price | Title Company |
|---|---|---|---|
| Turnbow James Byron Christina | $510,000 | -- | |
| Gaw Monte | -- | -- | |
| Hassler Lloyd R | $170,000 | -- | |
| Roussel Investments Lp | $280,000 | -- | |
| Gaw Oscar W | -- | -- | |
| Gaw Oscar W | -- | -- | |
| -- | -- | -- | |
| -- | -- | -- | |
| -- | -- | -- |
Source: Public Records
Mortgage History
| Date | Status | Borrower | Loan Amount |
|---|---|---|---|
| Previous Owner | Turnbow James Byron Christina | $500,000 |
Source: Public Records
Tax History Compared to Growth
Tax History
| Year | Tax Paid | Tax Assessment Tax Assessment Total Assessment is a certain percentage of the fair market value that is determined by local assessors to be the total taxable value of land and additions on the property. | Land | Improvement |
|---|---|---|---|---|
| 2024 | $4,808 | $134,300 | $22,150 | $112,150 |
| 2023 | $4,808 | $134,300 | $22,150 | $112,150 |
| 2022 | $4,421 | $134,300 | $22,150 | $112,150 |
| 2021 | $4,421 | $134,300 | $22,150 | $112,150 |
| 2020 | $4,581 | $134,300 | $22,150 | $112,150 |
| 2019 | $4,581 | $116,975 | $20,225 | $96,750 |
| 2018 | $3,451 | $96,650 | $20,225 | $76,425 |
| 2017 | $2,959 | $82,900 | $20,225 | $62,675 |
| 2016 | $2,959 | $82,900 | $20,225 | $62,675 |
| 2015 | $3,071 | $82,900 | $20,225 | $62,675 |
| 2014 | $3,433 | $92,669 | $0 | $0 |
Source: Public Records
Map
Nearby Homes
- 279 Willow Brook Dr
- 10.93 ac Eaton Rd
- 0 Eaton Rd
- 270 Locust Grove Rd
- 2.52 St
- 2136 W Broad St
- 0 Corner of W Broad St & Tn Ave Unit RTC2794105
- Lot 3 Miller
- 1957 W Broad St
- 2.52 ac W Broad St
- 500 N McBroom Chapel Rd
- 1345 Kensington Cir
- 1588 W Broad St
- 1552 1588 W Br0ad St
- 4131 Charlton Square
- 4060 Charlton Square
- 1440 Apple Valley Ct
- 4113 Buffalo Valley Rd
- 1408 Oak Grove Dr
- 4.60 AC Locust Grove Rd
- 0 Locust Grove Rd
- 715 Locust Grove Rd
- 725 Locust Grove Rd
- 510 Locust Grove Rd
- 2920 W Haven Dr
- 2924 W Haven Dr
- 484 Locust Grove Rd
- 299 Willow Brook Dr
- 2928 W Haven Dr
- 298 Willowbrook Dr
- 470 Locust Grove Rd
- 2932 W Haven Dr
- 295 Willow Brook Dr
- 868 Locust Grove Rd
- 467 Locust Grove Rd
- 2925 W Haven Dr
- 458 Locust Grove Rd
- 2936 W Haven Dr
- 291 Willow Brook Dr