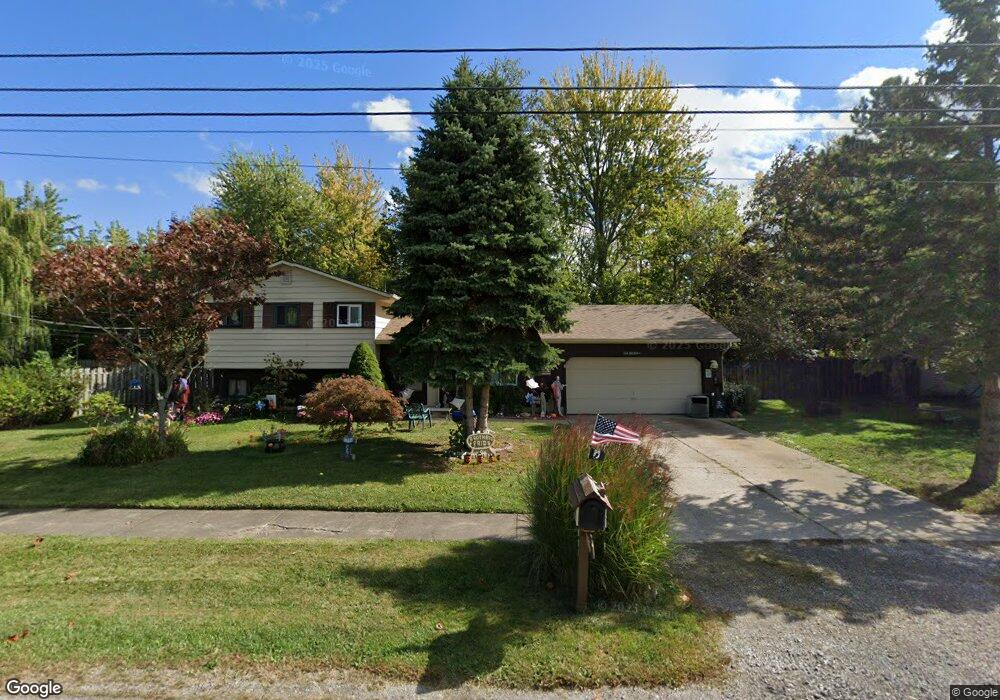
673 Maplewood Ave Sheffield Lake, OH 44054
Estimated Value: $140,000 - $232,000
3
Beds
2
Baths
1,600
Sq Ft
$123/Sq Ft
Est. Value
About This Home
This home is located at 673 Maplewood Ave, Sheffield Lake, OH 44054 and is currently estimated at $196,710, approximately $122 per square foot. 673 Maplewood Ave is a home located in Lorain County with nearby schools including Knollwood Elementary School, Brookside Intermediate School, and Brookside Middle School.
Ownership History
Date
Name
Owned For
Owner Type
Purchase Details
Closed on
Dec 17, 2021
Sold by
Mary Ellinwood Diana and Lee Dennis
Bought by
Sisler Gage and Speer Holly
Current Estimated Value
Home Financials for this Owner
Home Financials are based on the most recent Mortgage that was taken out on this home.
Original Mortgage
$106,043
Interest Rate
3.11%
Mortgage Type
FHA
Purchase Details
Closed on
Nov 9, 2021
Sold by
Tanko Carrie L
Bought by
Ellinwood Dennis L and Ellinwood Diana M
Home Financials for this Owner
Home Financials are based on the most recent Mortgage that was taken out on this home.
Original Mortgage
$106,043
Interest Rate
3.11%
Mortgage Type
FHA
Purchase Details
Closed on
May 29, 2013
Sold by
Ellinwood Dennis L and Ellinwood Diana M
Bought by
Tanko Carrie L
Create a Home Valuation Report for This Property
The Home Valuation Report is an in-depth analysis detailing your home's value as well as a comparison with similar homes in the area
Home Values in the Area
Average Home Value in this Area
Purchase History
| Date | Buyer | Sale Price | Title Company |
|---|---|---|---|
| Sisler Gage | $108,000 | Diaz Anselmo & Associates Pa | |
| Ellinwood Dennis L | -- | None Listed On Document | |
| Tanko Carrie L | $122,000 | None Available |
Source: Public Records
Mortgage History
| Date | Status | Borrower | Loan Amount |
|---|---|---|---|
| Previous Owner | Sisler Gage | $106,043 | |
| Previous Owner | Ellinwood Dennis L | $106,043 |
Source: Public Records
Tax History Compared to Growth
Tax History
| Year | Tax Paid | Tax Assessment Tax Assessment Total Assessment is a certain percentage of the fair market value that is determined by local assessors to be the total taxable value of land and additions on the property. | Land | Improvement |
|---|---|---|---|---|
| 2024 | $2,739 | $52,605 | $11,466 | $41,139 |
| 2023 | $2,691 | $45,441 | $11,956 | $33,485 |
| 2022 | $2,731 | $45,441 | $11,956 | $33,485 |
| 2021 | $2,747 | $45,441 | $11,956 | $33,485 |
| 2020 | $2,498 | $38,740 | $10,190 | $28,550 |
| 2019 | $2,484 | $38,740 | $10,190 | $28,550 |
| 2018 | $2,494 | $38,740 | $10,190 | $28,550 |
| 2017 | $1,573 | $31,030 | $4,330 | $26,700 |
| 2016 | $1,587 | $31,030 | $4,330 | $26,700 |
| 2015 | $1,567 | $31,030 | $4,330 | $26,700 |
| 2014 | $1,363 | $30,120 | $4,200 | $25,920 |
| 2013 | $1,357 | $30,120 | $4,200 | $25,920 |
Source: Public Records
Map
Nearby Homes
- 738 W Shore Blvd
- 762 Maplewood Ave
- 689 Lafayette Blvd
- 580 Alameda Ave
- 630 Treadway Blvd
- 644 Pasadena Ave
- 640 Pasadena Ave
- 552 Treadway Blvd
- 0 Kenilworth Ave
- 518 Lafayette Blvd
- 662 Kenilworth Ave
- 0 E Lake Rd
- VL Maplewood Ave
- 4502 Edgewater Dr
- 737 Dunny Ave
- 646 Dunny Ave
- 524 Irving Park Blvd
- 560 Elm St
- 4272 Brockley Ave
- 4260 Brockley Ave
- 683 Maplewood Ave
- 676 Maplewood Ave
- 666 Maplewood Ave
- 689 Maplewood Ave
- 656 Maplewood Ave
- 690 Maplewood Ave
- 652 Robinwood Ave
- 671 W Shore Blvd
- 647 Maplewood Ave
- 647 Maplewood Ave
- 677 W Shore Blvd
- V/L Maplewood Ave
- 663 W Shore Blvd
- 648 Maplewood Ave
- 655 W Shore Blvd
- 655 Robinwood Ave
- V/L Robinwood Ave
- 0 Robinwood Ave
- 689 W Shore Blvd
- 646 Robinwood Ave