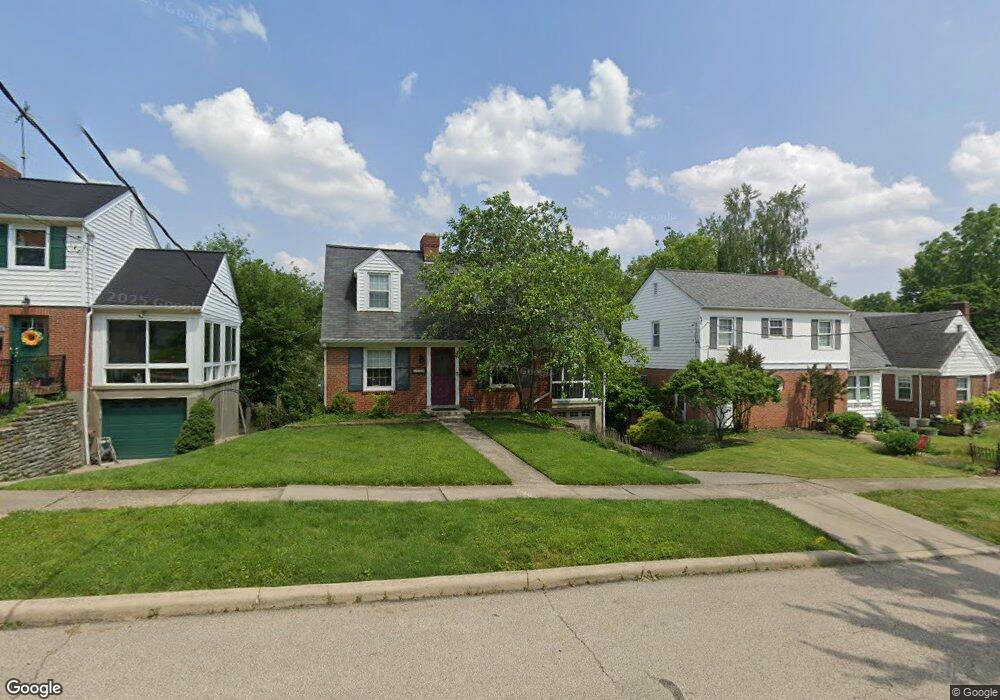
6730 Sampson Ln Cincinnati, OH 45236
Estimated Value: $237,558 - $314,000
2
Beds
1
Bath
1,260
Sq Ft
$221/Sq Ft
Est. Value
About This Home
This home is located at 6730 Sampson Ln, Cincinnati, OH 45236 and is currently estimated at $278,140, approximately $220 per square foot. 6730 Sampson Ln is a home located in Hamilton County with nearby schools including Silverton Paideia Elementary School, Shroder High School, and Clark Montessori High School.
Ownership History
Date
Name
Owned For
Owner Type
Purchase Details
Closed on
Mar 12, 2009
Sold by
Folzenlogen Heather and Folzenlogen Andrew
Bought by
Agin Amy A
Current Estimated Value
Home Financials for this Owner
Home Financials are based on the most recent Mortgage that was taken out on this home.
Original Mortgage
$123,717
Outstanding Balance
$77,601
Interest Rate
5.2%
Mortgage Type
FHA
Estimated Equity
$200,539
Purchase Details
Closed on
Mar 18, 2002
Sold by
Rudolph David R
Bought by
Hemsath Heather
Home Financials for this Owner
Home Financials are based on the most recent Mortgage that was taken out on this home.
Original Mortgage
$119,000
Interest Rate
6.93%
Mortgage Type
Balloon
Purchase Details
Closed on
Aug 25, 1995
Sold by
Moell Carl J and Walters Moell Jessica
Bought by
Rudolph David R
Home Financials for this Owner
Home Financials are based on the most recent Mortgage that was taken out on this home.
Original Mortgage
$60,800
Interest Rate
7.55%
Purchase Details
Closed on
Jan 19, 1994
Sold by
Crowe Ruth E
Bought by
Moell Ii Carl J
Create a Home Valuation Report for This Property
The Home Valuation Report is an in-depth analysis detailing your home's value as well as a comparison with similar homes in the area
Home Values in the Area
Average Home Value in this Area
Purchase History
We collect this data history from publicly available records. To have your information removed, we recommend requesting removal directly through your county’s website.
| Date | Buyer | Sale Price | Title Company |
|---|---|---|---|
| Agin Amy A | $126,000 | Attorney | |
| Hemsath Heather | $119,000 | -- | |
| Rudolph David R | -- | -- | |
| Moell Ii Carl J | -- | -- |
Source: Public Records
Mortgage History
We collect this data history from publicly available records. To have your information removed, we recommend requesting removal directly through your county’s website.
| Date | Status | Borrower | Loan Amount |
|---|---|---|---|
| Open | Agin Amy A | $123,717 | |
| Previous Owner | Hemsath Heather | $119,000 | |
| Previous Owner | Rudolph David R | $60,800 |
Source: Public Records
Tax History
| Year | Tax Paid | Tax Assessment Tax Assessment Total Assessment is a certain percentage of the fair market value that is determined by local assessors to be the total taxable value of land and additions on the property. | Land | Improvement |
|---|---|---|---|---|
| 2025 | $3,559 | $57,114 | $12,170 | $44,944 |
| 2023 | $3,331 | $57,114 | $12,170 | $44,944 |
| 2022 | $2,620 | $38,010 | $9,156 | $28,854 |
| 2021 | $2,551 | $38,010 | $9,156 | $28,854 |
| 2020 | $2,592 | $38,010 | $9,156 | $28,854 |
| 2019 | $2,822 | $37,265 | $8,978 | $28,287 |
| 2018 | $2,827 | $37,265 | $8,978 | $28,287 |
| 2017 | $2,700 | $37,265 | $8,978 | $28,287 |
| 2016 | $2,929 | $39,694 | $8,082 | $31,612 |
| 2015 | $2,649 | $39,694 | $8,082 | $31,612 |
| 2014 | $2,666 | $39,694 | $8,082 | $31,612 |
| 2013 | $3,010 | $44,101 | $8,978 | $35,123 |
Source: Public Records
Map
Nearby Homes
- 6733 Stoll Ln
- 6826 Sampson Ln
- 3947 Holman Cir
- 7049 Montgomery Rd
- 3947 Odin Ave
- 7045 Montgomery Rd
- 4155 Home St
- 4223 South Ave
- 6832 Kenton Ave
- 3848 Odin Ave
- 6910 Ohio Ave
- 3948 Odin Ave
- 6920 Montgomery Rd
- 3962 Standish Ave
- 6955 Carroll Ave
- 6918 Carroll Ave
- 3942 Standish Ave
- 6864 Park Ave
- 7111 Carnation Ave
- 7027 Glenellyn Dr
- 6734 Sampson Ln
- 6738 Sampson Ln
- 6742 Sampson Ln
- 6726 Sampson Ln
- 6733 Elwynne Dr
- 6737 Elwynne Dr
- 6722 Sampson Ln
- 6746 Sampson Ln
- 6729 Elwynne Dr
- 6725 Elwynne Dr
- 6741 Elwynne Dr
- 6720 Sampson Ln
- 6721 Elwynne Dr
- 6750 Sampson Ln
- 6745 Elwynne Dr
- 6735 Sampson Ln
- 6731 Sampson Ln
- 6739 Sampson Ln
- 6727 Sampson Ln
- 6717 Elwynne Dr
Your Personal Tour Guide
Ask me questions while you tour the home.