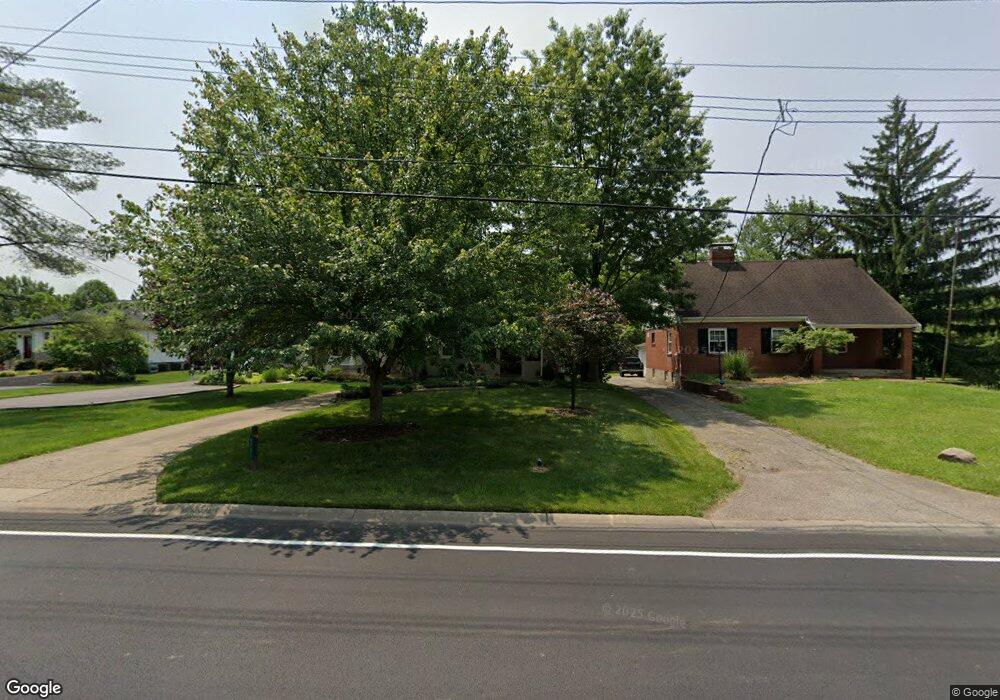
6731 Euclid Ave Cincinnati, OH 45243
Estimated Value: $502,361 - $599,000
4
Beds
2
Baths
2,188
Sq Ft
$241/Sq Ft
Est. Value
About This Home
This home is located at 6731 Euclid Ave, Cincinnati, OH 45243 and is currently estimated at $528,340, approximately $241 per square foot. 6731 Euclid Ave is a home located in Hamilton County with nearby schools including Madeira Elementary School, Madeira Middle School, and Madeira High School.
Ownership History
Date
Name
Owned For
Owner Type
Purchase Details
Closed on
Jun 27, 2008
Sold by
Moran Thomas T and Moran Shirley A
Bought by
Blackburn M Scott and Blackburn Katherine J
Current Estimated Value
Home Financials for this Owner
Home Financials are based on the most recent Mortgage that was taken out on this home.
Original Mortgage
$203,200
Outstanding Balance
$131,621
Interest Rate
6.15%
Mortgage Type
Unknown
Estimated Equity
$396,719
Purchase Details
Closed on
Apr 29, 2002
Sold by
Schneider Herbert P and Schneider Dianne C
Bought by
Moran Thomas T and Moran Shirley A
Home Financials for this Owner
Home Financials are based on the most recent Mortgage that was taken out on this home.
Original Mortgage
$133,600
Interest Rate
7.18%
Create a Home Valuation Report for This Property
The Home Valuation Report is an in-depth analysis detailing your home's value as well as a comparison with similar homes in the area
Home Values in the Area
Average Home Value in this Area
Purchase History
| Date | Buyer | Sale Price | Title Company |
|---|---|---|---|
| Blackburn M Scott | $254,000 | Prominent Title Agency Llc | |
| Moran Thomas T | $167,000 | Vintage Title Agency Inc |
Source: Public Records
Mortgage History
| Date | Status | Borrower | Loan Amount |
|---|---|---|---|
| Open | Blackburn M Scott | $203,200 | |
| Closed | Moran Thomas T | $133,600 |
Source: Public Records
Tax History Compared to Growth
Tax History
| Year | Tax Paid | Tax Assessment Tax Assessment Total Assessment is a certain percentage of the fair market value that is determined by local assessors to be the total taxable value of land and additions on the property. | Land | Improvement |
|---|---|---|---|---|
| 2024 | $6,397 | $111,384 | $32,928 | $78,456 |
| 2023 | $6,477 | $111,384 | $32,928 | $78,456 |
| 2022 | $6,385 | $89,803 | $26,341 | $63,462 |
| 2021 | $6,255 | $89,803 | $26,341 | $63,462 |
| 2020 | $5,781 | $89,803 | $26,341 | $63,462 |
| 2019 | $5,596 | $80,182 | $23,520 | $56,662 |
| 2018 | $5,641 | $80,182 | $23,520 | $56,662 |
| 2017 | $5,353 | $80,182 | $23,520 | $56,662 |
| 2016 | $5,788 | $81,694 | $13,171 | $68,523 |
| 2015 | $5,351 | $81,694 | $13,171 | $68,523 |
| 2014 | $5,382 | $81,694 | $13,171 | $68,523 |
| 2013 | $5,319 | $77,805 | $12,544 | $65,261 |
Source: Public Records
Map
Nearby Homes
- 6849 Springcrest Cir
- 6947 Euclid Ave
- 6866 Kenwood Rd
- 6887 Kenwood Rd
- 6752 Rose Crest Ave
- 6951 Miami Hills Dr
- 6638 Dawson Rd
- 6860 Dawson Rd
- 7002 Dawson Rd
- 7406 Dawson Rd
- 7112 Summit Ave
- 7317 Euclid Ave
- 7108 Fowler Ave
- 7389 Southside Ave
- 7474 Dawson Rd
- 7261 S Mingo Ln
- 7471 Mar Del Dr
- 7620 Montgomery Rd
- 7156 Maple Ave
- 7123 Silver Crest Dr
- 6711 Euclid Ave
- 6753 Euclid Ave
- 6747 Euclid Ave
- 6755 Euclid Ave
- 6691 Euclid Ave
- 6757 Euclid Ave
- 6530 Euclid Ave
- 6540 Euclid Ave
- 6773 Euclid Ave
- 6645 Euclid Ave
- 6754 Euclid Ave
- 6777 Euclid Ave
- 6510 Euclid Ave
- 6621 Euclid Ave
- 6667 Euclid Ave
- 6689 Euclid Ave
- 6758 Euclid Ave
- 6781 Euclid Ave
- 6591 Lisa Ln
- 6516 Euclid Ave