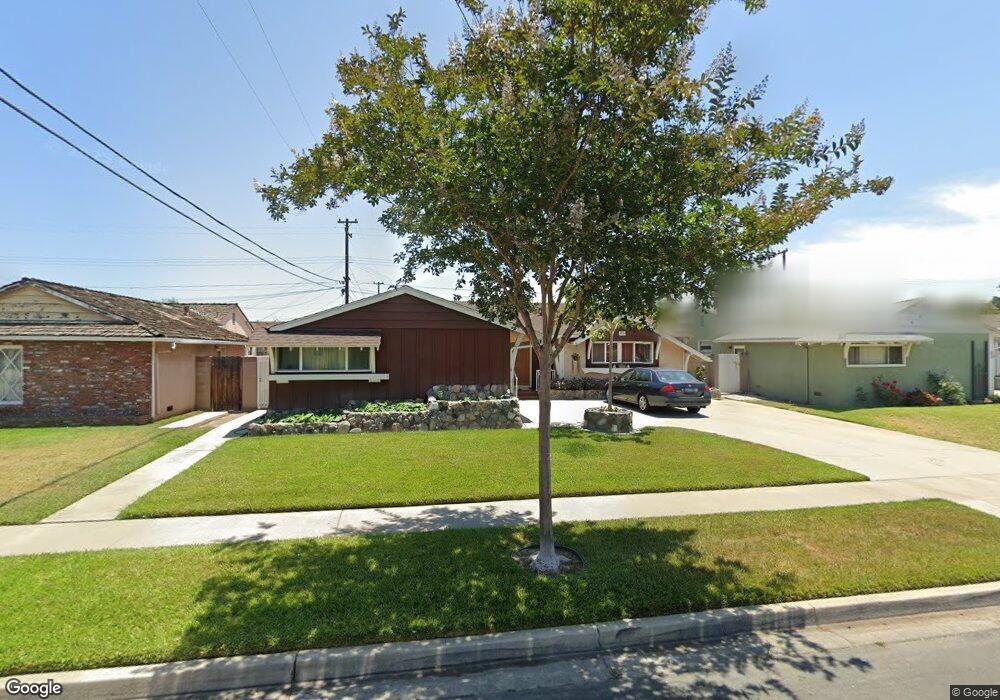
6734 Via Riviera Way Buena Park, CA 90620
Estimated Value: $852,000 - $960,677
4
Beds
2
Baths
1,287
Sq Ft
$712/Sq Ft
Est. Value
About This Home
This home is located at 6734 Via Riviera Way, Buena Park, CA 90620 and is currently estimated at $916,169, approximately $711 per square foot. 6734 Via Riviera Way is a home located in Orange County with nearby schools including San Marino Elementary School, Orangeview Junior High, and Western High School.
Ownership History
Date
Name
Owned For
Owner Type
Purchase Details
Closed on
May 25, 2011
Sold by
Federal Home Loan Mortgage Corporation
Bought by
Patel Mitesh and Patel Pallavi Mitesh
Current Estimated Value
Home Financials for this Owner
Home Financials are based on the most recent Mortgage that was taken out on this home.
Original Mortgage
$280,000
Outstanding Balance
$193,237
Interest Rate
4.73%
Mortgage Type
New Conventional
Estimated Equity
$722,932
Purchase Details
Closed on
Aug 19, 2010
Sold by
Han Ju Young and Han Myung Sook
Bought by
Federal Home Loan Mortgage Corporation
Purchase Details
Closed on
Apr 18, 2005
Sold by
Boehme Arthur A and Boehme Florence Alice Rae
Bought by
Han Ju Young and Han Myung Sook
Home Financials for this Owner
Home Financials are based on the most recent Mortgage that was taken out on this home.
Original Mortgage
$388,800
Interest Rate
1%
Mortgage Type
Fannie Mae Freddie Mac
Create a Home Valuation Report for This Property
The Home Valuation Report is an in-depth analysis detailing your home's value as well as a comparison with similar homes in the area
Home Values in the Area
Average Home Value in this Area
Purchase History
| Date | Buyer | Sale Price | Title Company |
|---|---|---|---|
| Patel Mitesh | $350,000 | Lsi Title Company | |
| Federal Home Loan Mortgage Corporation | $325,376 | None Available | |
| Han Ju Young | $486,000 | Southland Title Corporation |
Source: Public Records
Mortgage History
| Date | Status | Borrower | Loan Amount |
|---|---|---|---|
| Open | Patel Mitesh | $280,000 | |
| Previous Owner | Han Ju Young | $388,800 |
Source: Public Records
Tax History Compared to Growth
Tax History
| Year | Tax Paid | Tax Assessment Tax Assessment Total Assessment is a certain percentage of the fair market value that is determined by local assessors to be the total taxable value of land and additions on the property. | Land | Improvement |
|---|---|---|---|---|
| 2025 | $5,180 | $448,405 | $372,939 | $75,466 |
| 2024 | $5,180 | $439,613 | $365,626 | $73,987 |
| 2023 | $5,051 | $430,994 | $358,457 | $72,537 |
| 2022 | $4,986 | $422,544 | $351,429 | $71,115 |
| 2021 | $4,914 | $414,259 | $344,538 | $69,721 |
| 2020 | $4,885 | $410,012 | $341,005 | $69,007 |
| 2019 | $4,763 | $401,973 | $334,319 | $67,654 |
| 2018 | $4,676 | $394,092 | $327,764 | $66,328 |
| 2017 | $4,528 | $386,365 | $321,337 | $65,028 |
| 2016 | $4,441 | $378,790 | $315,037 | $63,753 |
| 2015 | $4,391 | $373,101 | $310,305 | $62,796 |
| 2014 | $4,170 | $365,793 | $304,227 | $61,566 |
Source: Public Records
Map
Nearby Homes
- 6681 Via Arroyo Dr
- 6528 University Way
- 9009 Harvard Ave
- 3402 W Danbrook Ave
- 9694 Mount Barnard Dr
- 6741 W Lincoln Ave Unit 32
- 17 Citrus Glen
- 6344 Orange Ave
- 6741 Lincoln Ave Unit 108
- 6741 Lincoln Ave Unit 155
- 9704 Doreen Dr
- 6507 San Alano Cir
- 3333 W Keys Ln
- 3300 W Orange Ave
- 6166 Orange Ave
- 3238 W Cabot Dr
- 6893 San Bruno Dr
- 6062 Lime Ave
- 7173 Monroe Ave
- 9792 Juanita St
- 6740 Via Riviera Way
- 6728 Via Riviera Way
- 9327 Via Vista Dr
- 9339 Via Vista Dr
- 9315 Via Vista Dr
- 6746 Via Riviera Way
- 6722 Via Riviera Way
- 6723 Via Riviera Way
- 9303 Via Vista Dr
- 9351 Via Vista Dr
- 6733 Via Riviera Way
- 6715 Via Riviera Way
- 6752 Via Riviera Way
- 6718 Via Riviera Way
- 6741 Via Riviera Way
- 9291 Via Vista Dr
- 9363 Via Vista Dr
- 6714 Via Riviera Way
- 6751 Via Riviera Way
- 6697 Via Riviera Way