Estimated Value: $395,000 - $406,000
3
Beds
2
Baths
1,880
Sq Ft
$213/Sq Ft
Est. Value
About This Home
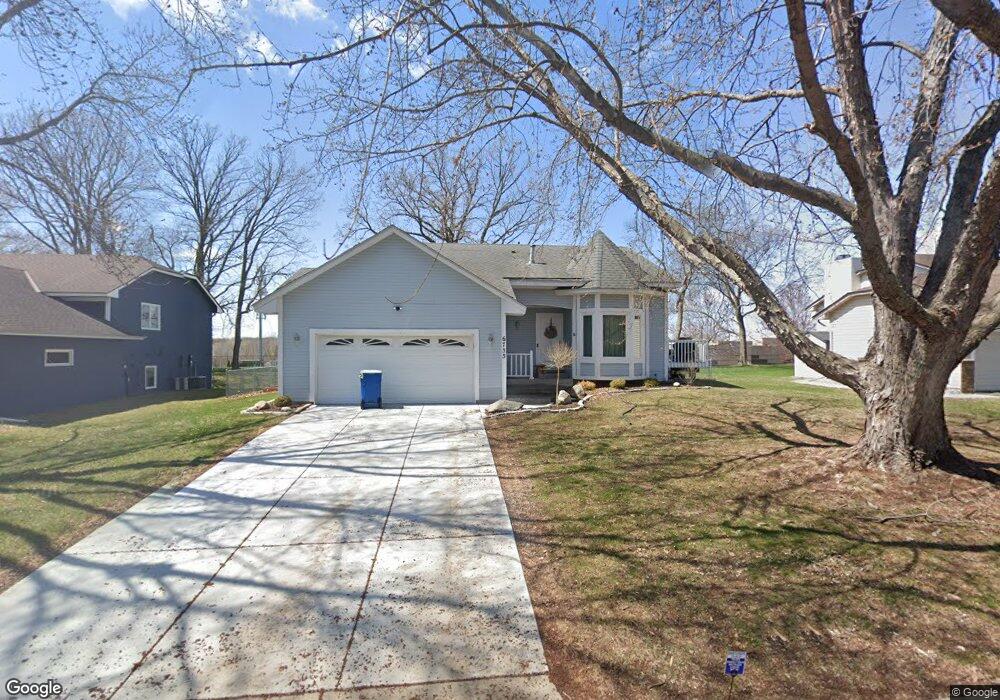
This home is located at 6735 Quantico Ln N, Osseo, MN 55311 and is currently estimated at $400,547, approximately $213 per square foot. 6735 Quantico Ln N is a home located in Hennepin County with nearby schools including Basswood Elementary School, Maple Grove Middle School, and Maple Grove Senior High School.
Ownership History
Date
Name
Owned For
Owner Type
Purchase Details
Closed on
Feb 14, 2020
Sold by
Opendoor Property C Llc
Bought by
Smith Rachel M and Smith Jared A
Current Estimated Value
Home Financials for this Owner
Home Financials are based on the most recent Mortgage that was taken out on this home.
Original Mortgage
$260,100
Outstanding Balance
$230,823
Interest Rate
3.72%
Mortgage Type
VA
Estimated Equity
$169,724
Purchase Details
Closed on
Aug 6, 2019
Sold by
Sponholz Mark P and Sponholz Sarah R
Bought by
Opendoor Property C Llc
Purchase Details
Closed on
Jul 26, 2007
Sold by
Holt Ian C and Holt Pamela
Bought by
Sirva Relocation Llc
Purchase Details
Closed on
Jul 30, 1999
Sold by
Klegon Jenifer L and Klegon Jeff R
Bought by
Holt Ian C
Purchase Details
Closed on
Jul 29, 1998
Sold by
Barrett Robert P and Barrett Jan E
Bought by
Klegon Jeffrey and Klegon Jenifer
Create a Home Valuation Report for This Property
The Home Valuation Report is an in-depth analysis detailing your home's value as well as a comparison with similar homes in the area
Home Values in the Area
Average Home Value in this Area
Purchase History
| Date | Buyer | Sale Price | Title Company |
|---|---|---|---|
| Smith Rachel M | $289,000 | North American Title Company | |
| Opendoor Property C Llc | $306,700 | Opendoor Title Llc | |
| Sirva Relocation Llc | $270,000 | -- | |
| Sponholz Mark P | $270,000 | -- | |
| Holt Ian C | $164,900 | -- | |
| Klegon Jeffrey | $149,900 | -- |
Source: Public Records
Mortgage History
| Date | Status | Borrower | Loan Amount |
|---|---|---|---|
| Open | Smith Rachel M | $260,100 |
Source: Public Records
Tax History Compared to Growth
Tax History
| Year | Tax Paid | Tax Assessment Tax Assessment Total Assessment is a certain percentage of the fair market value that is determined by local assessors to be the total taxable value of land and additions on the property. | Land | Improvement |
|---|---|---|---|---|
| 2024 | $561 | $346,100 | $123,800 | $222,300 |
| 2023 | $2,184 | $336,200 | $108,900 | $227,300 |
| 2022 | $3,526 | $360,100 | $107,100 | $253,000 |
| 2021 | $3,353 | $299,000 | $84,000 | $215,000 |
| 2020 | $3,411 | $281,300 | $72,500 | $208,800 |
| 2019 | $3,755 | $262,400 | $63,500 | $198,900 |
| 2018 | $3,672 | $246,300 | $61,000 | $185,300 |
| 2017 | $3,246 | $234,700 | $73,000 | $161,700 |
| 2016 | $2,918 | $211,200 | $58,000 | $153,200 |
| 2015 | $3,025 | $212,700 | $63,000 | $149,700 |
| 2014 | -- | $185,800 | $50,000 | $135,800 |
Source: Public Records
Map
Nearby Homes
- 6848 Polaris Ln N
- 15097 67th Place N
- 7082 Weston Ln N
- 7094 Weston Ln N
- 7099 Weston Ln N
- 6386 Minnesota Ln N
- 16314 70th Ave N
- 16236 70th Place N
- 7244 Quantico Ln N
- 7261 Quantico Ln N
- 16322 70th Ave N Unit 204
- 6413 Archer Ln N
- 6336 Yuma Ln N
- 15770 73rd Place N
- 16370 62nd Place N
- 6225 Vicksburg Ln N
- 7071 Empire Ln N
- 6726 Fountain Ln N
- 7453 Mariner Dr
- 13940 64th Ave N
- 6723 Quantico Ln N
- 6747 Quantico Ln N
- 6715 Quantico Ln N
- 6726 Quantico Ln N
- 6744 Quantico Ln N
- 6748 Quantico Ln N
- 6765 Quantico Ln N
- 6701 Quantico Ln N
- 6708 Quantico Ln N
- 6762 Quantico Ln N
- 15362 67th Place N
- 15363 67th Place N
- 6797 Quantico Ln N
- 6693 Quantico Ln N
- 6780 Quantico Ln N
- 15422 67th Ave N
- 6809 Quantico Ln N
- 15368 67th Ave N
- 6681 Quantico Ln N
- 15351 67th Place N