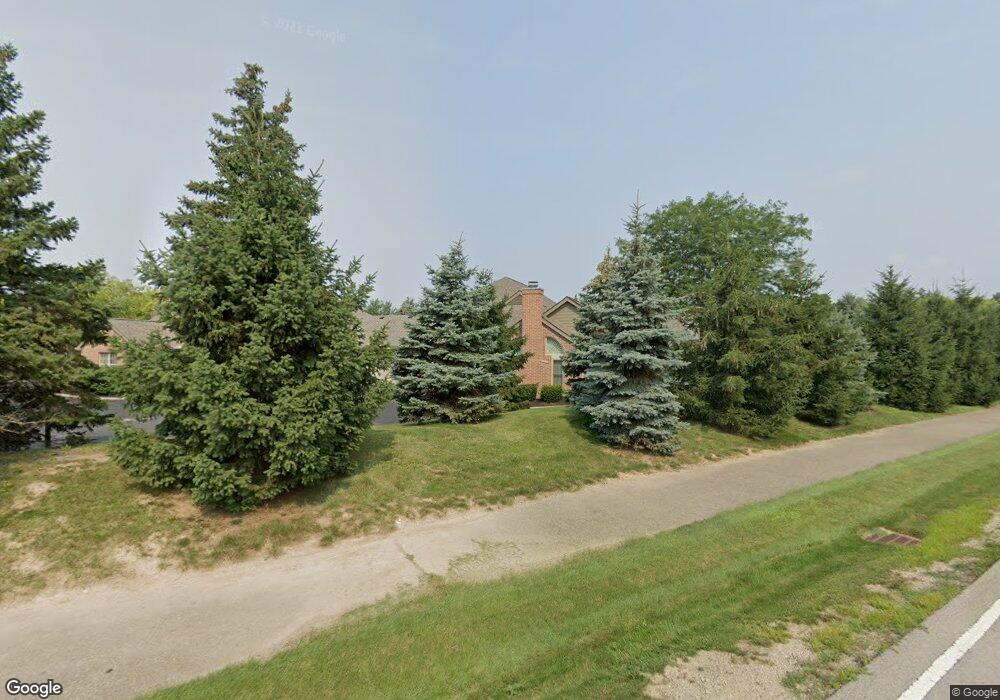
6738 Heatherstone Loop Unit 6738 Dublin, OH 43017
Estimated Value: $324,000 - $374,000
3
Beds
2
Baths
1,513
Sq Ft
$227/Sq Ft
Est. Value
About This Home
This home is located at 6738 Heatherstone Loop Unit 6738, Dublin, OH 43017 and is currently estimated at $344,161, approximately $227 per square foot. 6738 Heatherstone Loop Unit 6738 is a home located in Franklin County with nearby schools including Scottish Corners Elementary School, Henry Karrer Middle School, and Dublin Coffman High School.
Ownership History
Date
Name
Owned For
Owner Type
Purchase Details
Closed on
Mar 20, 2017
Sold by
Johnson Patricia L
Bought by
Johnson Pattie and The Pattie Johnson Revocable T
Current Estimated Value
Purchase Details
Closed on
Mar 5, 2012
Sold by
Johnson Carol M
Bought by
Johnson Patricia L
Home Financials for this Owner
Home Financials are based on the most recent Mortgage that was taken out on this home.
Original Mortgage
$83,800
Outstanding Balance
$56,811
Interest Rate
3.9%
Mortgage Type
New Conventional
Estimated Equity
$287,350
Purchase Details
Closed on
Sep 26, 2008
Sold by
Windau Joseph D
Bought by
Johnson Carol M
Home Financials for this Owner
Home Financials are based on the most recent Mortgage that was taken out on this home.
Original Mortgage
$87,900
Interest Rate
6.11%
Mortgage Type
Purchase Money Mortgage
Purchase Details
Closed on
May 20, 1996
Sold by
Donald R Kenney Trustee
Bought by
Joseph D Windau
Create a Home Valuation Report for This Property
The Home Valuation Report is an in-depth analysis detailing your home's value as well as a comparison with similar homes in the area
Home Values in the Area
Average Home Value in this Area
Purchase History
| Date | Buyer | Sale Price | Title Company |
|---|---|---|---|
| Johnson Pattie | -- | None Available | |
| Johnson Patricia L | -- | Prosource Title Agency | |
| Johnson Carol M | $152,900 | Mcs Title B | |
| Joseph D Windau | $121,900 | -- |
Source: Public Records
Mortgage History
| Date | Status | Borrower | Loan Amount |
|---|---|---|---|
| Open | Johnson Patricia L | $83,800 | |
| Closed | Johnson Carol M | $87,900 |
Source: Public Records
Tax History
| Year | Tax Paid | Tax Assessment Tax Assessment Total Assessment is a certain percentage of the fair market value that is determined by local assessors to be the total taxable value of land and additions on the property. | Land | Improvement |
|---|---|---|---|---|
| 2025 | $6,433 | $99,020 | $18,200 | $80,820 |
| 2024 | $6,433 | $99,020 | $18,200 | $80,820 |
| 2023 | $6,344 | $99,020 | $18,200 | $80,820 |
| 2022 | $4,494 | $64,120 | $10,780 | $53,340 |
| 2021 | $4,505 | $64,120 | $10,780 | $53,340 |
| 2020 | $4,542 | $64,120 | $10,780 | $53,340 |
| 2019 | $4,668 | $58,280 | $9,800 | $48,480 |
| 2018 | $4,498 | $58,280 | $9,800 | $48,480 |
| 2017 | $4,344 | $58,280 | $9,800 | $48,480 |
| 2016 | $4,279 | $53,900 | $10,850 | $43,050 |
| 2015 | $4,307 | $53,900 | $10,850 | $43,050 |
| 2014 | $4,312 | $53,900 | $10,850 | $43,050 |
| 2013 | $2,194 | $53,900 | $10,850 | $43,050 |
Source: Public Records
Map
Nearby Homes
- 6770 Heatherstone Loop Unit 6770
- 6105 Craughwell Ln
- 6219 Craughwell Ln
- 6001 Craughwell Ln Unit 4
- 6148 Inishmore Ln
- 9786 Mesquite Ct
- 9806 Mesquite Ct
- 7027 Dublin Village Dr
- 7199 Achill Dr
- 6341 Tara Hill Dr
- 6920 Barksdale Dr
- 6976 Barksdale Dr
- 7081 Wendy Trail Ln
- 5647 Tara Hill Dr
- 5578 Corey Swirl Dr
- 7246 Sundown Ct
- 7162 Drummore Ct
- 7135 Drummore Ct
- 7154 Drummore Ct
- 6258 Wexford Woods Dr
- 6754 Heatherstone Loop
- 6746 Heatherstone Loop Unit 6746
- 6730 Heatherstone Loop Unit 6730
- 6722 Heatherstone Loop
- 6714 Heatherstone Loop
- 6762 Heatherstone Loop
- 6706 Heatherstone Loop
- 6778 Heatherstone Loop
- 6698 Heatherstone Loop
- 6786 Heatherstone Loop
- 6651 Heatherstone Loop
- 6794 Heatherstone Loop Unit 6794
- 6651 Heatherstone Cir
- 6802 Heatherstone Loop Unit 6802
- 6643 Heatherstone Loop
- 6810 Heatherstone Cir
- 6682 Heatherstone Loop
- 6690 Heatherstone Loop Unit 6690
- 6810 Heatherstone Loop
- 6818 Heatherstone Loop Unit 6818
Your Personal Tour Guide
Ask me questions while you tour the home.