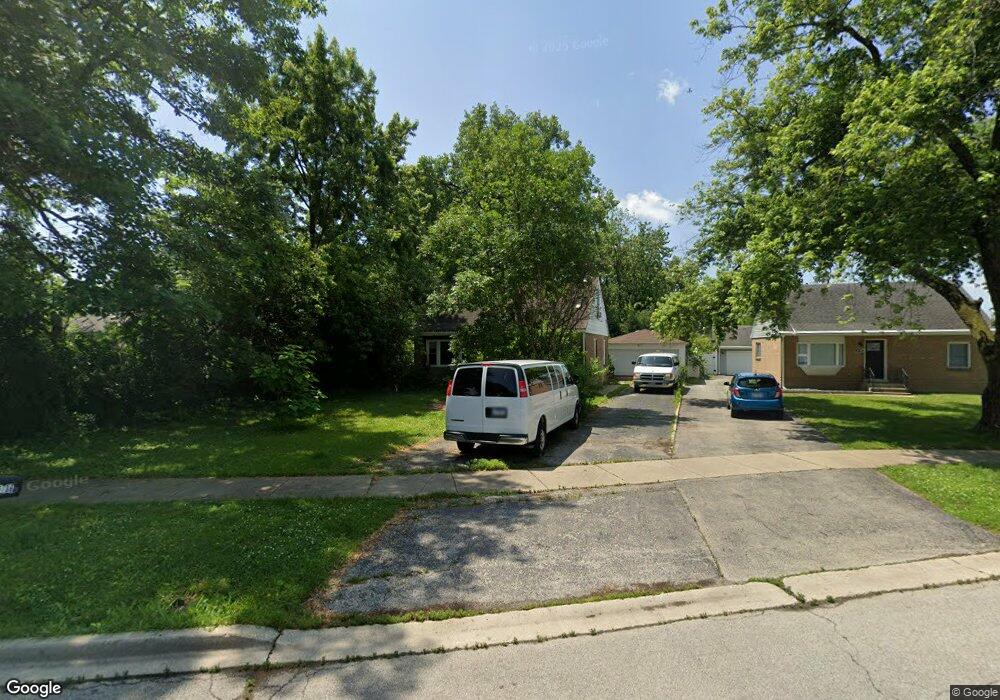
6738 S 79th Ave Bridgeview, IL 60455
Estimated Value: $260,000 - $320,000
3
Beds
2
Baths
1,073
Sq Ft
$263/Sq Ft
Est. Value
About This Home
This home is located at 6738 S 79th Ave, Bridgeview, IL 60455 and is currently estimated at $282,479, approximately $263 per square foot. 6738 S 79th Ave is a home located in Cook County with nearby schools including W.W. Walker Elementary School, Dr Donald Wharton Elementary School, and Walsh Elementary School.
Ownership History
Date
Name
Owned For
Owner Type
Purchase Details
Closed on
Feb 5, 2001
Sold by
Rice Kevin T and Rice Lynda M
Bought by
Delcarmen Campos Victor M and Delcarmen Dominquez Maria
Current Estimated Value
Home Financials for this Owner
Home Financials are based on the most recent Mortgage that was taken out on this home.
Original Mortgage
$109,000
Interest Rate
7.18%
Purchase Details
Closed on
Nov 14, 1997
Sold by
Buczek Stanley H
Bought by
Rice Kevin T and Rice Lynda M
Home Financials for this Owner
Home Financials are based on the most recent Mortgage that was taken out on this home.
Original Mortgage
$109,000
Interest Rate
7.45%
Mortgage Type
Unknown
Purchase Details
Closed on
Sep 15, 1995
Sold by
Buczek Nancy L
Bought by
Buczek Stanley H
Create a Home Valuation Report for This Property
The Home Valuation Report is an in-depth analysis detailing your home's value as well as a comparison with similar homes in the area
Home Values in the Area
Average Home Value in this Area
Purchase History
| Date | Buyer | Sale Price | Title Company |
|---|---|---|---|
| Delcarmen Campos Victor M | $129,000 | -- | |
| Rice Kevin T | $115,000 | Attorneys Natl Title Network | |
| Buczek Stanley H | -- | -- |
Source: Public Records
Mortgage History
| Date | Status | Borrower | Loan Amount |
|---|---|---|---|
| Closed | Delcarmen Campos Victor M | $109,000 | |
| Previous Owner | Rice Kevin T | $109,000 |
Source: Public Records
Tax History
| Year | Tax Paid | Tax Assessment Tax Assessment Total Assessment is a certain percentage of the fair market value that is determined by local assessors to be the total taxable value of land and additions on the property. | Land | Improvement |
|---|---|---|---|---|
| 2025 | $7,089 | $22,000 | $4,447 | $17,553 |
| 2024 | $7,089 | $22,000 | $4,447 | $17,553 |
| 2023 | $6,058 | $22,000 | $4,447 | $17,553 |
| 2022 | $6,058 | $17,430 | $3,953 | $13,477 |
| 2021 | $5,844 | $16,738 | $3,952 | $12,786 |
| 2020 | $5,994 | $16,738 | $3,952 | $12,786 |
| 2019 | $5,441 | $14,676 | $3,705 | $10,971 |
| 2018 | $5,229 | $14,676 | $3,705 | $10,971 |
| 2017 | $5,162 | $14,676 | $3,705 | $10,971 |
| 2016 | $4,919 | $12,700 | $3,211 | $9,489 |
| 2015 | $4,591 | $12,700 | $3,211 | $9,489 |
| 2014 | $4,509 | $12,700 | $3,211 | $9,489 |
| 2013 | $5,296 | $16,145 | $3,211 | $12,934 |
Source: Public Records
Map
Nearby Homes
- 6807 S 79th Ave
- 7851 Suburban Ln
- 6918 Garden Ln
- 7824 W 66th Place
- 7705 Columbia Dr
- 7813 W 65th Place
- 7710 66th St
- 7702 W 66th St
- 7214 S 78th Ave
- 7912 W 73rd St
- 7838 W 73rd Place
- 7957 W 73rd Place
- 7945 W 73rd Place
- 7502 64th St
- 7948 74th St
- 7420 W 63rd Place
- 7421 W 64th St
- 7929 W 74th St
- 7524 W 63rd Place
- 7332 Beloit Ave
- 6742 S 79th Ave
- 6734 S 79th Ave
- 6750 S 79th Ave
- 6730 S 79th Ave
- 6801 Columbia Dr
- 6755 Columbia Dr
- 6749 Columbia Dr
- 6805 Columbia Dr
- 6800 S 79th Ave
- 6745 Columbia Dr
- 6720 S 79th Ave
- 6809 Columbia Dr
- 6741 Columbia Dr
- 7904 Suburban Ln
- 7912 Suburban Ln
- 6743 S 79th Ave
- 7908 Suburban Ln
- 7900 Suburban Ln
- 6749 S 79th Ave
- 6755 S 79th Ave
Your Personal Tour Guide
Ask me questions while you tour the home.