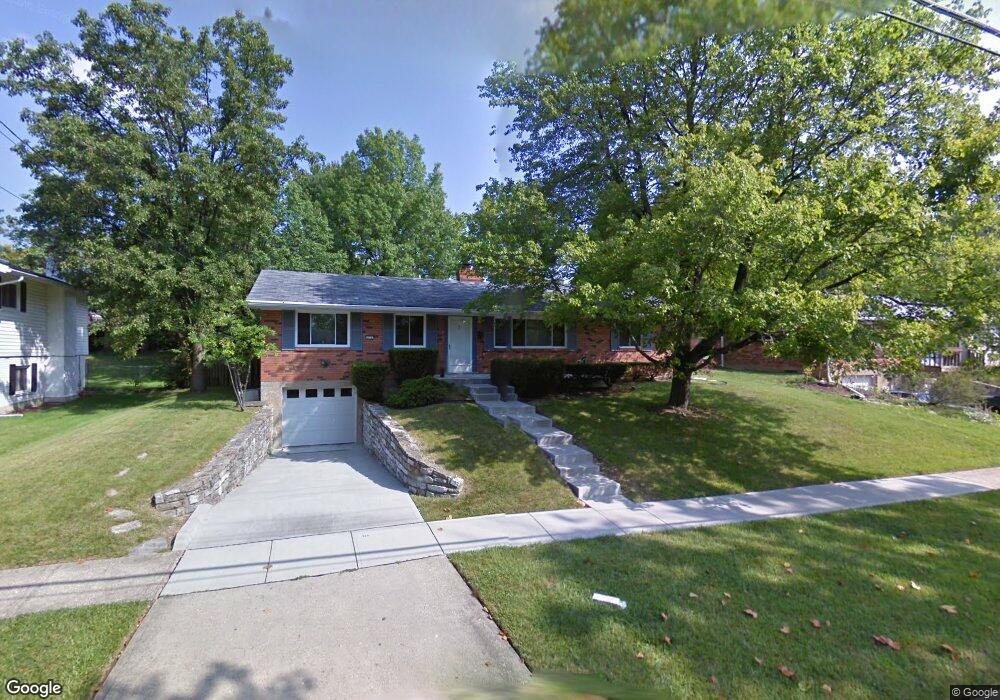
674 Carlsbad Rd Cincinnati, OH 45240
Estimated Value: $168,000 - $256,000
3
Beds
2
Baths
1,607
Sq Ft
$130/Sq Ft
Est. Value
About This Home
This home is located at 674 Carlsbad Rd, Cincinnati, OH 45240 and is currently estimated at $209,230, approximately $130 per square foot. 674 Carlsbad Rd is a home located in Hamilton County with nearby schools including Calvary Academy- The and St Gabriel Consolidated School.
Ownership History
Date
Name
Owned For
Owner Type
Purchase Details
Closed on
Jun 15, 1997
Sold by
Hopson Brian and Hopson Sonya
Bought by
Jones Charles A
Current Estimated Value
Home Financials for this Owner
Home Financials are based on the most recent Mortgage that was taken out on this home.
Original Mortgage
$93,609
Outstanding Balance
$10,947
Interest Rate
7.94%
Mortgage Type
FHA
Estimated Equity
$198,283
Purchase Details
Closed on
Nov 16, 1995
Sold by
Smudski Jeffrey and Smudski Adriana H
Bought by
Hopson Brian
Home Financials for this Owner
Home Financials are based on the most recent Mortgage that was taken out on this home.
Original Mortgage
$87,935
Interest Rate
7.56%
Mortgage Type
FHA
Create a Home Valuation Report for This Property
The Home Valuation Report is an in-depth analysis detailing your home's value as well as a comparison with similar homes in the area
Home Values in the Area
Average Home Value in this Area
Purchase History
| Date | Buyer | Sale Price | Title Company |
|---|---|---|---|
| Jones Charles A | $94,000 | -- | |
| Hopson Brian | -- | -- |
Source: Public Records
Mortgage History
| Date | Status | Borrower | Loan Amount |
|---|---|---|---|
| Open | Jones Charles A | $93,609 | |
| Previous Owner | Hopson Brian | $87,935 |
Source: Public Records
Tax History
| Year | Tax Paid | Tax Assessment Tax Assessment Total Assessment is a certain percentage of the fair market value that is determined by local assessors to be the total taxable value of land and additions on the property. | Land | Improvement |
|---|---|---|---|---|
| 2025 | $3,183 | $52,598 | $10,437 | $42,161 |
| 2024 | $3,185 | $52,598 | $10,437 | $42,161 |
| 2023 | $3,167 | $52,598 | $10,437 | $42,161 |
| 2022 | $3,010 | $37,937 | $9,286 | $28,651 |
| 2021 | $3,000 | $37,937 | $9,286 | $28,651 |
| 2020 | $2,964 | $37,937 | $9,286 | $28,651 |
| 2019 | $2,826 | $31,616 | $7,739 | $23,877 |
| 2018 | $2,831 | $31,616 | $7,739 | $23,877 |
| 2017 | $2,760 | $31,616 | $7,739 | $23,877 |
| 2016 | $2,679 | $29,761 | $8,155 | $21,606 |
| 2015 | $2,461 | $29,761 | $8,155 | $21,606 |
| 2014 | $2,276 | $29,761 | $8,155 | $21,606 |
| 2013 | $2,345 | $31,329 | $8,586 | $22,743 |
Source: Public Records
Map
Nearby Homes
- 749 Converse Dr
- 683 Danbury Rd
- 835 Cascade Rd
- 483 Vista Glen Dr
- 77 Handel Ln
- 11131 Hanover Rd
- 440 W Sharon Rd
- 10619 Deauville Rd
- 162 Sheffield Rd
- 37 Hayden Dr
- 68 Gambier Cir
- 30 Gambier Cir
- 11481 Fremantle Dr
- 784 Farnham Ct
- 11570 Rose Ln
- 6 Chalmers Ct
- 604 Smiley Ave
- 11 Dewitt Ct
- 9 Dewitt Ct
- 7 Dewitt Ct
- 670 Carlsbad Rd
- 680 Carlsbad Rd
- 673 Converse Dr
- 664 Carlsbad Rd
- 679 Converse Dr
- 10800 Corona Rd
- 677 Carlsbad Rd
- 600 Cascade Rd
- 667 Converse Dr
- 681 Carlsbad Rd
- 10806 Corona Rd
- 658 Carlsbad Rd
- 685 Converse Dr
- 663 Carlsbad Rd
- 685 Carlsbad Rd
- 604 Cascade Rd
- 661 Converse Dr
- 10810 Corona Rd
- 687 Carlsbad Rd
- 657 Carlsbad Rd
Your Personal Tour Guide
Ask me questions while you tour the home.