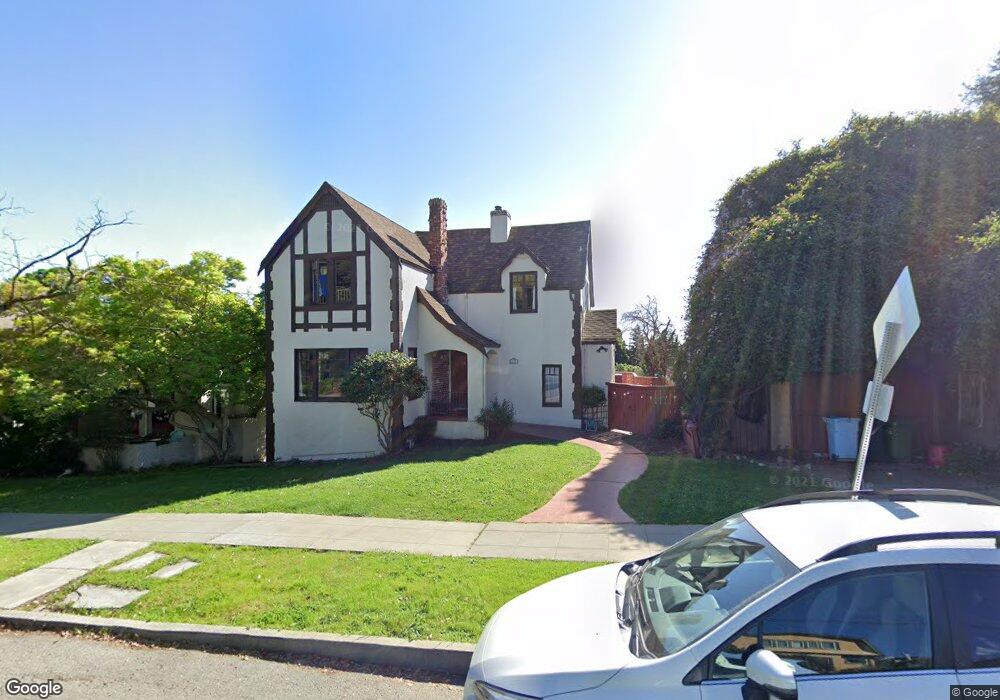
674 Colusa Ave Berkeley, CA 94707
Thousand Oaks NeighborhoodEstimated Value: $1,637,000 - $1,882,000
3
Beds
2
Baths
1,834
Sq Ft
$953/Sq Ft
Est. Value
About This Home
This home is located at 674 Colusa Ave, Berkeley, CA 94707 and is currently estimated at $1,747,416, approximately $952 per square foot. 674 Colusa Ave is a home located in Alameda County with nearby schools including Thousand Oaks Elementary School, Ruth Acty Elementary, and Berkeley Arts Magnet at Whittier School.
Ownership History
Date
Name
Owned For
Owner Type
Purchase Details
Closed on
Feb 4, 2021
Sold by
Thompson Catherine A
Bought by
Thompson Catherine A and The Catherine A Thompson 2012
Current Estimated Value
Home Financials for this Owner
Home Financials are based on the most recent Mortgage that was taken out on this home.
Original Mortgage
$307,758
Interest Rate
2.7%
Mortgage Type
New Conventional
Purchase Details
Closed on
Aug 22, 2012
Sold by
Thompson Catherine A A and Thompson Frank A
Bought by
Revo Thompson Catherine A and Revo Catherine A Thompson 2012
Purchase Details
Closed on
Oct 3, 2007
Sold by
Thompson Catherine A and The Frank A & Catherine A Thom
Bought by
Thompson Catherine A
Home Financials for this Owner
Home Financials are based on the most recent Mortgage that was taken out on this home.
Original Mortgage
$270,000
Interest Rate
6.4%
Mortgage Type
New Conventional
Purchase Details
Closed on
Jun 15, 2005
Sold by
Thompson Frank A and Thompson Catherine A
Bought by
Thompson Frank A and Thompson Catherine A
Create a Home Valuation Report for This Property
The Home Valuation Report is an in-depth analysis detailing your home's value as well as a comparison with similar homes in the area
Home Values in the Area
Average Home Value in this Area
Purchase History
| Date | Buyer | Sale Price | Title Company |
|---|---|---|---|
| Thompson Catherine A | -- | Amrock Inc | |
| Thompson Catherine A | -- | Amrock Inc | |
| Revo Thompson Catherine A | -- | None Available | |
| Thompson Catherine A | -- | Placer Title Company | |
| Thompson Frank A | -- | -- |
Source: Public Records
Mortgage History
| Date | Status | Borrower | Loan Amount |
|---|---|---|---|
| Closed | Thompson Catherine A | $307,758 | |
| Closed | Thompson Catherine A | $270,000 |
Source: Public Records
Tax History
| Year | Tax Paid | Tax Assessment Tax Assessment Total Assessment is a certain percentage of the fair market value that is determined by local assessors to be the total taxable value of land and additions on the property. | Land | Improvement |
|---|---|---|---|---|
| 2025 | $7,639 | $143,869 | $52,468 | $98,401 |
| 2024 | $7,639 | $140,910 | $51,439 | $96,471 |
| 2023 | $7,388 | $145,011 | $50,431 | $94,580 |
| 2022 | $7,608 | $135,168 | $49,442 | $92,726 |
| 2021 | $7,556 | $132,380 | $48,472 | $90,908 |
| 2020 | $6,964 | $137,952 | $47,976 | $89,976 |
| 2019 | $6,459 | $135,247 | $47,035 | $88,212 |
| 2018 | $6,254 | $132,596 | $46,113 | $86,483 |
| 2017 | $6,013 | $129,996 | $45,209 | $84,787 |
| 2016 | $5,619 | $127,447 | $44,322 | $83,125 |
| 2015 | $5,491 | $125,533 | $43,657 | $81,876 |
| 2014 | $5,348 | $123,073 | $42,801 | $80,272 |
Source: Public Records
Map
Nearby Homes
- 753 Peralta Ave
- 1858 San Lorenzo Ave
- 731 Santa fe Ave
- 415 Berkeley Park Blvd
- 491 Vincente Ave
- 1983 Yosemite Rd
- 118 Ramona Ave
- 145 Ramona Ave
- 1498 Sonoma Ave
- 1266 Washington Ave
- 840 Key Route Blvd
- 712 Masonic Ave
- 589 San Luis Rd
- 1741 Sonoma Ave
- 765 San Diego Rd
- 1236 Portland Ave
- 1036 Ramona Ave
- 813 San Diego Rd
- 483 Boynton Ave
- 450 Vermont Ave
- 670 Colusa Ave
- 678 Colusa Ave
- 1731 Portland Ave
- 664 Colusa Ave
- 684 Colusa Ave
- 1715 Portland Ave
- 658 Colusa Ave
- 675 Colusa Ave
- 690 Colusa Ave
- 671 Colusa Ave
- 679 Colusa Ave
- 667 Colusa Ave
- 699 Ensenada Ave
- 1730 Portland Ave
- 654 Colusa Ave
- 685 Colusa Ave
- 663 Colusa Ave
- 695 Ensenada Ave
- 773 Vincente Ave
- 657 Colusa Ave
Your Personal Tour Guide
Ask me questions while you tour the home.