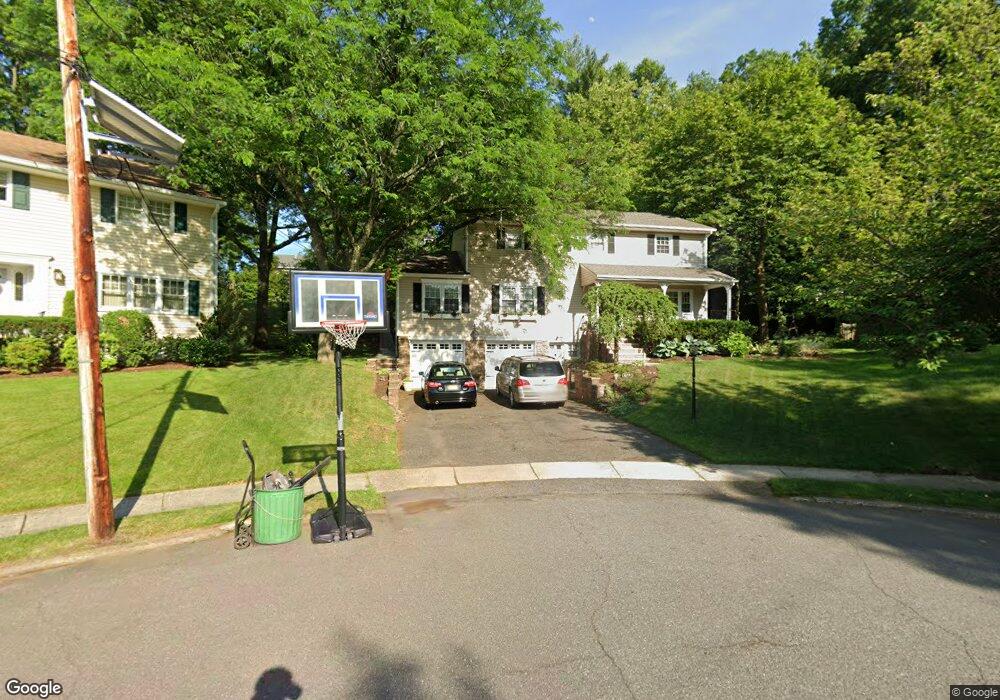
674 Westview Ct River Edge, NJ 07661
Estimated Value: $1,066,360 - $1,263,000
--
Bed
--
Bath
2,412
Sq Ft
$483/Sq Ft
Est. Value
About This Home
This home is located at 674 Westview Ct, River Edge, NJ 07661 and is currently estimated at $1,165,090, approximately $483 per square foot. 674 Westview Ct is a home located in Bergen County with nearby schools including Roosevelt Elementary School, River Dell Middle School, and River Dell Regional High School.
Ownership History
Date
Name
Owned For
Owner Type
Purchase Details
Closed on
Feb 4, 2011
Sold by
The Paper Mill Real Estate Trust and Hollenstein Paul J
Bought by
Brignola Christopher and Brignola Lucia
Current Estimated Value
Home Financials for this Owner
Home Financials are based on the most recent Mortgage that was taken out on this home.
Original Mortgage
$350,000
Outstanding Balance
$239,269
Interest Rate
4.76%
Mortgage Type
Purchase Money Mortgage
Estimated Equity
$925,821
Create a Home Valuation Report for This Property
The Home Valuation Report is an in-depth analysis detailing your home's value as well as a comparison with similar homes in the area
Home Values in the Area
Average Home Value in this Area
Purchase History
| Date | Buyer | Sale Price | Title Company |
|---|---|---|---|
| Brignola Christopher | $570,000 | -- |
Source: Public Records
Mortgage History
| Date | Status | Borrower | Loan Amount |
|---|---|---|---|
| Open | Brignola Christopher | $350,000 |
Source: Public Records
Tax History Compared to Growth
Tax History
| Year | Tax Paid | Tax Assessment Tax Assessment Total Assessment is a certain percentage of the fair market value that is determined by local assessors to be the total taxable value of land and additions on the property. | Land | Improvement |
|---|---|---|---|---|
| 2025 | $23,017 | $819,200 | $369,200 | $450,000 |
| 2024 | $22,442 | $580,500 | $294,200 | $286,300 |
| 2023 | $21,479 | $580,500 | $294,200 | $286,300 |
| 2022 | $21,479 | $580,500 | $294,200 | $286,300 |
| 2021 | $21,055 | $580,500 | $294,200 | $286,300 |
| 2020 | $20,724 | $580,500 | $294,200 | $286,300 |
| 2019 | $20,132 | $580,500 | $294,200 | $286,300 |
| 2018 | $19,708 | $580,500 | $294,200 | $286,300 |
| 2017 | $19,516 | $580,500 | $294,200 | $286,300 |
| 2016 | $19,075 | $580,500 | $294,200 | $286,300 |
| 2015 | $18,675 | $580,500 | $294,200 | $286,300 |
| 2014 | $18,710 | $580,500 | $294,200 | $286,300 |
Source: Public Records
Map
Nearby Homes
- 712 6th Ave
- 761 6th Ave
- 766 7th Ave
- 276 Greenway Terrace
- 784 Millbrook Rd
- 331 Ellen Place
- 168 Voorhis Ave
- 366 Spring Valley Rd
- 215 Kensington Rd
- 374 E Midland Ave
- 390 Spring Valley Rd
- 855 Kinderkamack Rd
- 33 Lincoln Ave
- 1 Sipporta Ln
- 366 Forest Ave
- 189 Forest Ave Unit 409
- 189 Forest Ave Unit 303
- 327 E Midland Ave
- 140 River Edge Ave
- 378 Windsor Rd