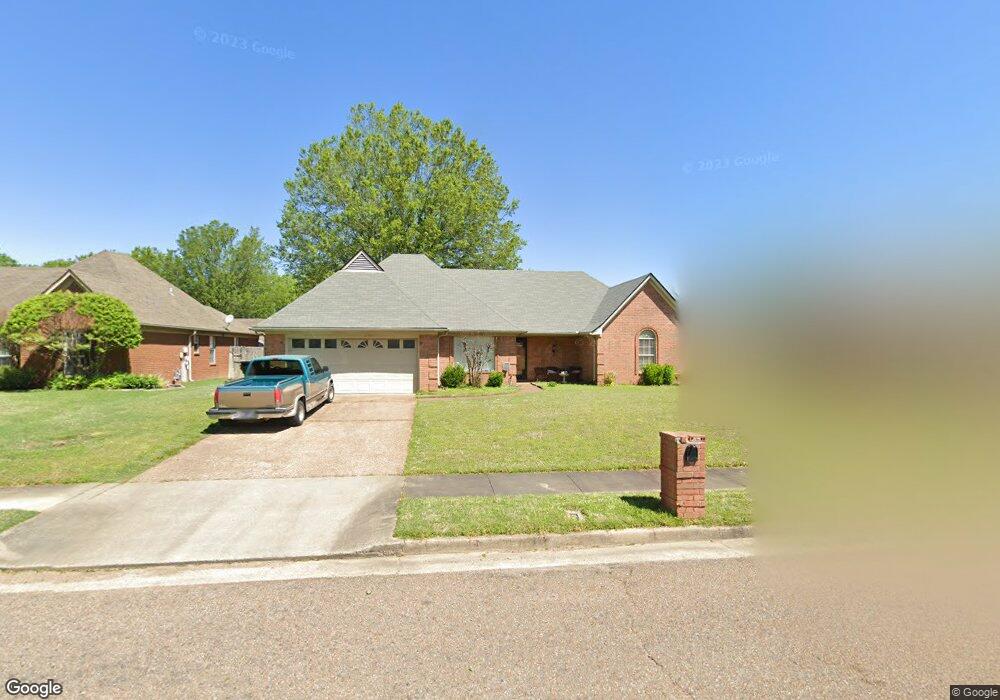
6740 Hidden Fern Ln E Memphis, TN 38135
Estimated Value: $298,000 - $322,000
3
Beds
2
Baths
1,591
Sq Ft
$192/Sq Ft
Est. Value
About This Home
This home is located at 6740 Hidden Fern Ln E, Memphis, TN 38135 and is currently estimated at $305,849, approximately $192 per square foot. 6740 Hidden Fern Ln E is a home located in Shelby County with nearby schools including Ellendale Elementary School, Appling Middle School, and Bartlett High School.
Ownership History
Date
Name
Owned For
Owner Type
Purchase Details
Closed on
Mar 30, 2006
Sold by
Vanguard Investments Inc
Bought by
Kearney Aaron and Kearney Patricia
Current Estimated Value
Home Financials for this Owner
Home Financials are based on the most recent Mortgage that was taken out on this home.
Original Mortgage
$154,755
Outstanding Balance
$101,156
Interest Rate
8.87%
Mortgage Type
Fannie Mae Freddie Mac
Estimated Equity
$204,693
Purchase Details
Closed on
Dec 13, 2005
Sold by
Mccarter Katherine Lynn
Bought by
Vanguard Investments Inc
Purchase Details
Closed on
Nov 1, 2000
Sold by
Mccarter Richard M
Bought by
Mccarter Katherine Lynn
Create a Home Valuation Report for This Property
The Home Valuation Report is an in-depth analysis detailing your home's value as well as a comparison with similar homes in the area
Home Values in the Area
Average Home Value in this Area
Purchase History
| Date | Buyer | Sale Price | Title Company |
|---|---|---|---|
| Kearney Aaron | $162,900 | None Available | |
| Vanguard Investments Inc | $110,500 | -- | |
| Mccarter Katherine Lynn | -- | -- |
Source: Public Records
Mortgage History
| Date | Status | Borrower | Loan Amount |
|---|---|---|---|
| Open | Kearney Aaron | $154,755 |
Source: Public Records
Tax History Compared to Growth
Tax History
| Year | Tax Paid | Tax Assessment Tax Assessment Total Assessment is a certain percentage of the fair market value that is determined by local assessors to be the total taxable value of land and additions on the property. | Land | Improvement |
|---|---|---|---|---|
| 2025 | $1,621 | $72,275 | $15,550 | $56,725 |
| 2024 | $1,621 | $47,825 | $10,350 | $37,475 |
| 2023 | $2,449 | $47,825 | $10,350 | $37,475 |
| 2022 | $2,449 | $47,825 | $10,350 | $37,475 |
| 2021 | $2,487 | $47,825 | $10,350 | $37,475 |
| 2020 | $2,298 | $39,075 | $9,250 | $29,825 |
| 2019 | $2,298 | $39,075 | $9,250 | $29,825 |
| 2018 | $2,298 | $39,075 | $9,250 | $29,825 |
| 2017 | $1,606 | $39,075 | $9,250 | $29,825 |
| 2016 | $1,478 | $33,825 | $0 | $0 |
| 2014 | $1,478 | $33,825 | $0 | $0 |
Source: Public Records
Map
Nearby Homes
- 6806 Canna Hill Cove
- 4166 Hobbs Cove
- 6656 Millgrove Park Dr
- 6640 Laurel Valley Dr
- 6793 Autumnhill Ln
- 6864 Aspenhill Dr
- 6558 Laurel Bluff Ct E
- 3893 Altruria Rd
- 4309 Garner Place
- 3956 Laurelhill Ln
- 0 Egypt Central Rd Unit 10191682
- 4118 Luther Rd
- 6495 Birch Mill Rd
- 4260 Steffan Woods Cove
- 6963 Fairhill Ln
- 3777 S Bluff Point
- 4200 Brookhill Ln
- 6884 Talcott Ln
- 6886 Talcott Ln
- 6888 Talcott Ln
- 6730 Hidden Fern Ln E
- 6723 Wild Cove
- 6743 Wild Cove
- 6743 Wild Cove Unit C
- 6720 Hidden Fern Ln E
- 6760 Hidden Fern Ln E
- 4039 Wood Hearth Cove
- 6715 Wild Cove
- 6721 Hidden Fern Ln E
- 6759 Hidden Fern Ln E
- 6710 Hidden Fern Ln E
- 6747 Wild Cove
- 6705 Wild Cove
- 4029 Wood Hearth Cove
- 6711 Hidden Fern Ln E
- 4030 Wood Hearth Cove
- 6724 Wild Cove
- 6734 Wild Cove
- 6700 Hidden Fern Ln E
- 6716 Wild Cove