Estimated Value: $851,000 - $966,000
4
Beds
3
Baths
2,047
Sq Ft
$436/Sq Ft
Est. Value
About This Home
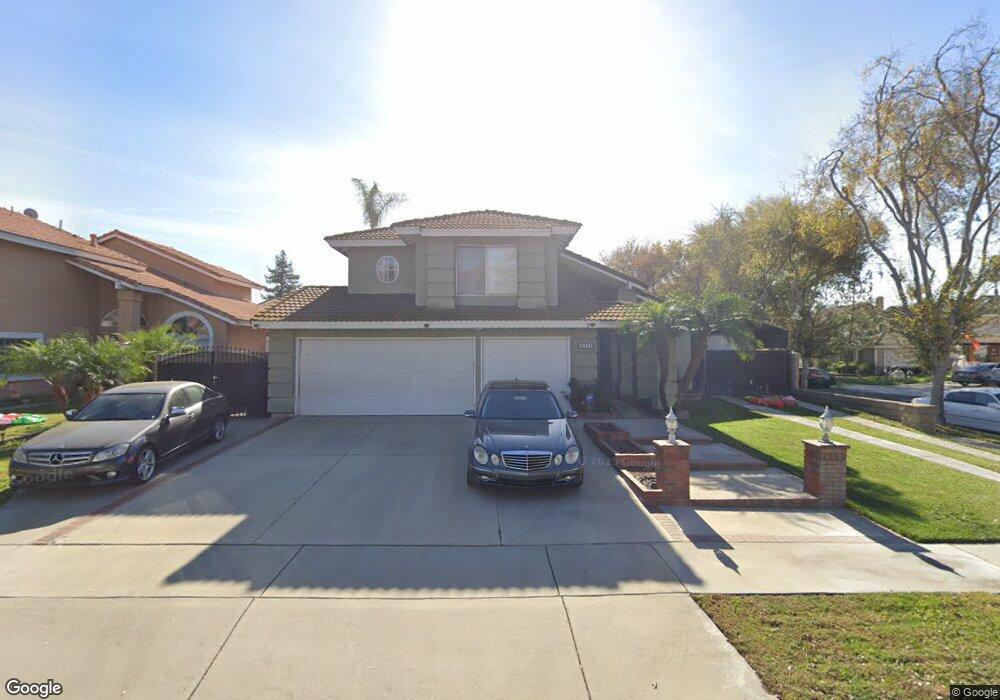
This home is located at 6741 Groves Ct, Chino, CA 91710 and is currently estimated at $893,152, approximately $436 per square foot. 6741 Groves Ct is a home located in San Bernardino County with nearby schools including Howard Cattle Elementary, Magnolia Junior High, and Chino High School.
Ownership History
Date
Name
Owned For
Owner Type
Purchase Details
Closed on
Apr 5, 2011
Sold by
Mejia Raymond Lorenzo and Mejia Ramon Lorenzo
Bought by
Mejia Raymond Lorenzo
Current Estimated Value
Home Financials for this Owner
Home Financials are based on the most recent Mortgage that was taken out on this home.
Original Mortgage
$307,000
Interest Rate
4.84%
Mortgage Type
New Conventional
Purchase Details
Closed on
Sep 4, 2001
Sold by
Mejia Ramon Lorenzo and Mejia Deanna Camille
Bought by
Mejia Ramon Lorenzo
Home Financials for this Owner
Home Financials are based on the most recent Mortgage that was taken out on this home.
Original Mortgage
$210,000
Interest Rate
6.91%
Purchase Details
Closed on
Jul 25, 1998
Sold by
Camille Mejia Ramon L and Camille Deanna
Bought by
Mejia Ramon Lorenzo and Mejia Deanna Camille
Purchase Details
Closed on
Aug 3, 1995
Sold by
Mejia Ramon L and Mejia Deanna
Bought by
Mejia Ramon L
Home Financials for this Owner
Home Financials are based on the most recent Mortgage that was taken out on this home.
Original Mortgage
$173,500
Interest Rate
7.71%
Create a Home Valuation Report for This Property
The Home Valuation Report is an in-depth analysis detailing your home's value as well as a comparison with similar homes in the area
Home Values in the Area
Average Home Value in this Area
Purchase History
| Date | Buyer | Sale Price | Title Company |
|---|---|---|---|
| Mejia Raymond Lorenzo | -- | North American Title | |
| Mejia Ramon Lorenzo | -- | Southland Title Corporation | |
| Mejia Ramon Lorenzo | -- | -- | |
| Mejia Ramon L | -- | Old Republic Title Company |
Source: Public Records
Mortgage History
| Date | Status | Borrower | Loan Amount |
|---|---|---|---|
| Closed | Mejia Raymond Lorenzo | $307,000 | |
| Closed | Mejia Ramon Lorenzo | $210,000 | |
| Closed | Mejia Ramon L | $173,500 |
Source: Public Records
Tax History Compared to Growth
Tax History
| Year | Tax Paid | Tax Assessment Tax Assessment Total Assessment is a certain percentage of the fair market value that is determined by local assessors to be the total taxable value of land and additions on the property. | Land | Improvement |
|---|---|---|---|---|
| 2025 | $4,698 | $416,128 | $135,821 | $280,307 |
| 2024 | $4,698 | $407,969 | $133,158 | $274,811 |
| 2023 | $4,573 | $399,970 | $130,547 | $269,423 |
| 2022 | $4,547 | $392,127 | $127,987 | $264,140 |
| 2021 | $4,462 | $384,438 | $125,477 | $258,961 |
| 2020 | $4,406 | $380,496 | $124,190 | $256,306 |
| 2019 | $4,333 | $373,035 | $121,755 | $251,280 |
| 2018 | $4,241 | $365,721 | $119,368 | $246,353 |
| 2017 | $4,169 | $358,550 | $117,027 | $241,523 |
| 2016 | $3,907 | $351,519 | $114,732 | $236,787 |
| 2015 | $3,832 | $346,239 | $113,009 | $233,230 |
| 2014 | $3,760 | $339,456 | $110,795 | $228,661 |
Source: Public Records
Map
Nearby Homes
- 13360 Goldmedal Ave
- 13462 Mashona Ave
- 13119 San Antonio Ave
- 6903 Montego St
- 13255 Copra Ave
- 13102 Melon Ave
- 13035 Arlington Ln
- 13775 Harvard Ave
- 6952 Silverado St
- 6594 Manzanita Ct
- 13028 Melon Ave
- 6833 Renato Ct
- 13846 Farmhouse Ave
- 13006 Falcon Place
- 13022 Cypress Ave
- 6441 Susana St
- 11610 Granville Place
- 6648 Riverside Dr Unit 3
- 12834 Zinnea Ave
- 6630 Mogano Dr
- 6749 Groves Ct
- 6742 Palmer Ct
- 6750 Palmer Ct
- 6757 Groves Ct
- 13442 Garcia Ave
- 13452 Garcia Ave
- 6758 Palmer Ct
- 6740 Groves Ct
- 13432 Garcia Ave
- 6748 Groves Ct
- 13462 Garcia Ave
- 6765 Groves Ct
- 13422 Garcia Ave
- 6766 Palmer Ct
- 13472 Garcia Ave
- 6756 Groves Ct
- 13412 Garcia Ave
- 13403 Garcia Ave
- 6773 Groves Ct
- 13404 Garcia Ave