67438 310th St Maxwell, IA 50161
Estimated Value: $256,000 - $381,685
3
Beds
1
Bath
1,678
Sq Ft
$202/Sq Ft
Est. Value
About This Home
This home is located at 67438 310th St, Maxwell, IA 50161 and is currently estimated at $339,421, approximately $202 per square foot. 67438 310th St is a home located in Story County with nearby schools including Collins-Maxwell Elementary School and Collins-Maxwell Middle/High School.
Ownership History
Date
Name
Owned For
Owner Type
Purchase Details
Closed on
Jun 24, 2013
Sold by
Dinwiddie Darcy Ann and Johnson Jason
Bought by
Johnson Darcy A and Johnson Jason
Current Estimated Value
Home Financials for this Owner
Home Financials are based on the most recent Mortgage that was taken out on this home.
Original Mortgage
$146,000
Outstanding Balance
$32,828
Interest Rate
3.52%
Mortgage Type
New Conventional
Estimated Equity
$306,593
Create a Home Valuation Report for This Property
The Home Valuation Report is an in-depth analysis detailing your home's value as well as a comparison with similar homes in the area
Home Values in the Area
Average Home Value in this Area
Purchase History
| Date | Buyer | Sale Price | Title Company |
|---|---|---|---|
| Johnson Darcy A | -- | None Available |
Source: Public Records
Mortgage History
| Date | Status | Borrower | Loan Amount |
|---|---|---|---|
| Open | Johnson Darcy A | $146,000 |
Source: Public Records
Tax History Compared to Growth
Tax History
| Year | Tax Paid | Tax Assessment Tax Assessment Total Assessment is a certain percentage of the fair market value that is determined by local assessors to be the total taxable value of land and additions on the property. | Land | Improvement |
|---|---|---|---|---|
| 2025 | $3,890 | $334,600 | $153,000 | $181,600 |
| 2024 | $3,808 | $316,200 | $140,000 | $176,200 |
| 2023 | $3,220 | $316,200 | $140,000 | $176,200 |
| 2022 | $3,312 | $227,900 | $86,800 | $141,100 |
| 2021 | $3,372 | $227,900 | $86,800 | $141,100 |
| 2020 | $3,222 | $218,000 | $86,800 | $131,200 |
| 2019 | $3,222 | $212,500 | $86,800 | $125,700 |
| 2018 | $2,496 | $181,700 | $65,000 | $116,700 |
| 2017 | $2,496 | $181,700 | $65,000 | $116,700 |
| 2016 | $2,404 | $176,500 | $65,000 | $111,500 |
| 2015 | $2,404 | $176,500 | $65,000 | $111,500 |
| 2014 | $2,414 | $173,900 | $65,000 | $108,900 |
Source: Public Records
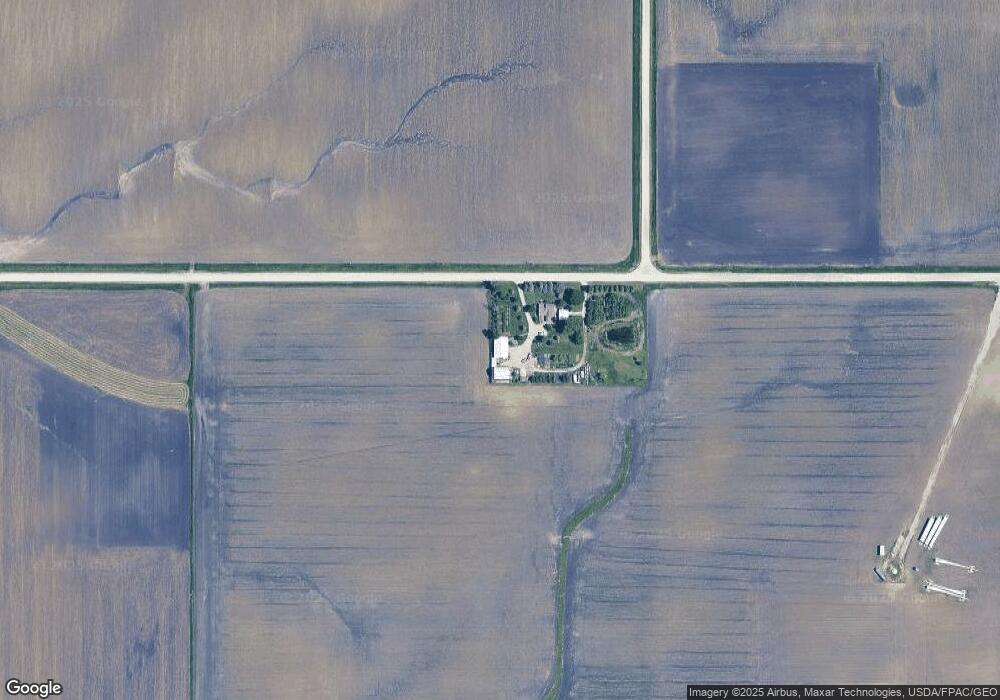
Map
Nearby Homes