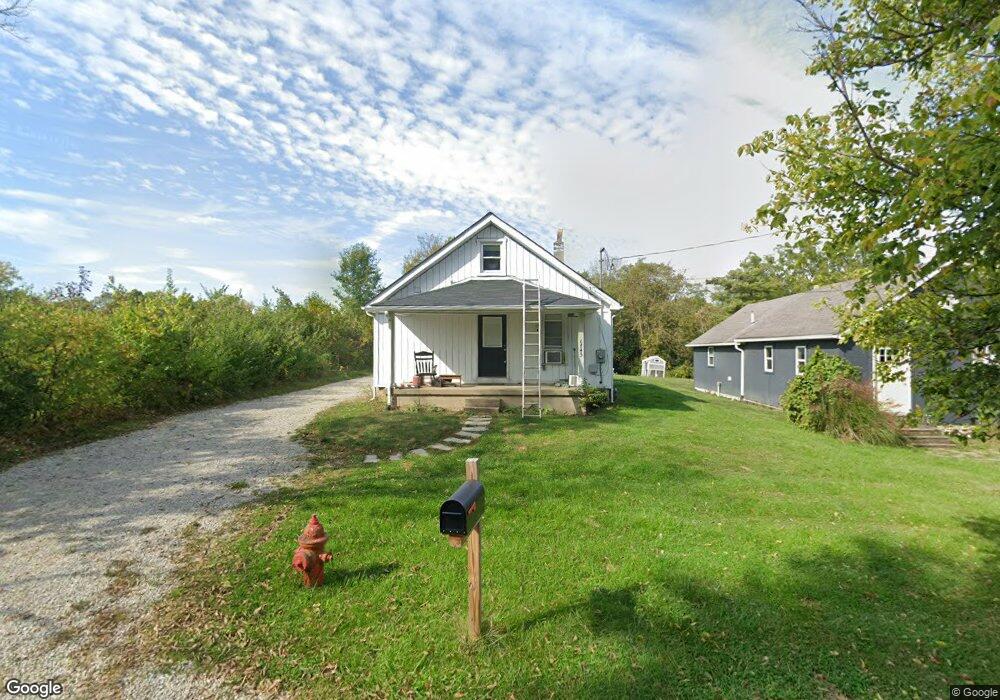
6745 Maple Dr Franklin, OH 45005
Estimated Value: $113,714 - $239,000
3
Beds
3
Baths
1,787
Sq Ft
$94/Sq Ft
Est. Value
About This Home
This home is located at 6745 Maple Dr, Franklin, OH 45005 and is currently estimated at $167,679, approximately $93 per square foot. 6745 Maple Dr is a home located in Warren County with nearby schools including Franklin High School.
Ownership History
Date
Name
Owned For
Owner Type
Purchase Details
Closed on
Oct 20, 2016
Sold by
Robertson Ron and Robertson Sarah J
Bought by
Gray Jordan S
Current Estimated Value
Home Financials for this Owner
Home Financials are based on the most recent Mortgage that was taken out on this home.
Original Mortgage
$62,448
Outstanding Balance
$49,555
Interest Rate
3.48%
Mortgage Type
FHA
Estimated Equity
$118,124
Purchase Details
Closed on
Nov 7, 2015
Sold by
Ball Amy Y
Bought by
Robertson Ron and Robertson Sarah J
Purchase Details
Closed on
Oct 17, 2001
Sold by
Robertson Ron
Bought by
Ball Keith
Home Financials for this Owner
Home Financials are based on the most recent Mortgage that was taken out on this home.
Original Mortgage
$70,000
Interest Rate
6.92%
Mortgage Type
New Conventional
Purchase Details
Closed on
Oct 29, 1987
Sold by
Coldiron Felix and Coldiron Felix
Bought by
Ron Robertson and Ron Ron
Purchase Details
Closed on
Dec 5, 1979
Sold by
Coldiron Coldiron and Coldiron Luther
Purchase Details
Closed on
Nov 17, 1978
Sold by
Schockley Schockley and Schockley Ruby
Create a Home Valuation Report for This Property
The Home Valuation Report is an in-depth analysis detailing your home's value as well as a comparison with similar homes in the area
Home Values in the Area
Average Home Value in this Area
Purchase History
| Date | Buyer | Sale Price | Title Company |
|---|---|---|---|
| Gray Jordan S | $65,600 | Hallmark Title | |
| Robertson Ron | -- | Attorney | |
| Ball Keith | $75,000 | -- | |
| Ron Robertson | $5,500 | -- | |
| -- | -- | -- | |
| -- | -- | -- |
Source: Public Records
Mortgage History
| Date | Status | Borrower | Loan Amount |
|---|---|---|---|
| Open | Gray Jordan S | $62,448 | |
| Previous Owner | Ball Keith | $70,000 |
Source: Public Records
Tax History
| Year | Tax Paid | Tax Assessment Tax Assessment Total Assessment is a certain percentage of the fair market value that is determined by local assessors to be the total taxable value of land and additions on the property. | Land | Improvement |
|---|---|---|---|---|
| 2025 | $1,533 | $34,500 | $14,790 | $19,710 |
| 2024 | $1,533 | $34,500 | $14,790 | $19,710 |
| 2023 | $1,308 | $26,474 | $10,444 | $16,030 |
| 2022 | $1,277 | $26,474 | $10,444 | $16,030 |
| 2021 | $1,206 | $26,474 | $10,444 | $16,030 |
| 2020 | $1,213 | $23,429 | $9,244 | $14,186 |
| 2019 | $1,097 | $23,429 | $9,244 | $14,186 |
| 2018 | $1,087 | $23,429 | $9,244 | $14,186 |
| 2017 | $1,172 | $22,785 | $8,470 | $14,315 |
| 2016 | $1,221 | $22,785 | $8,470 | $14,315 |
| 2015 | $1,281 | $22,785 | $8,470 | $14,315 |
| 2014 | $1,175 | $21,490 | $7,990 | $13,500 |
| 2013 | $1,003 | $24,860 | $9,240 | $15,620 |
Source: Public Records
Map
Nearby Homes
- 1117 S Main St
- 5684 Olive Rd
- 6633 Rivulet Dr
- 5925 Millbrook Dr
- 6323 Shaker Rd
- 100 Pleasant Hill Blvd
- 7189 Shaker Rd
- 5865 Hayden Dr
- 5757 S Dixie Hwy
- 5013 Waterford Ln
- 5019 Waterford Dr
- 4822 Miller Rd
- 0 Oxford Rd
- 1924 Tipperary Dr
- 25 Timber Creek Dr
- 65 Timber Creek Dr
- 5760 Autumn Dr
- 6006 Tributary Park
- 4964 Timberline Dr Unit 81
- 0 Kathy Ln Unit 1834240
Your Personal Tour Guide
Ask me questions while you tour the home.