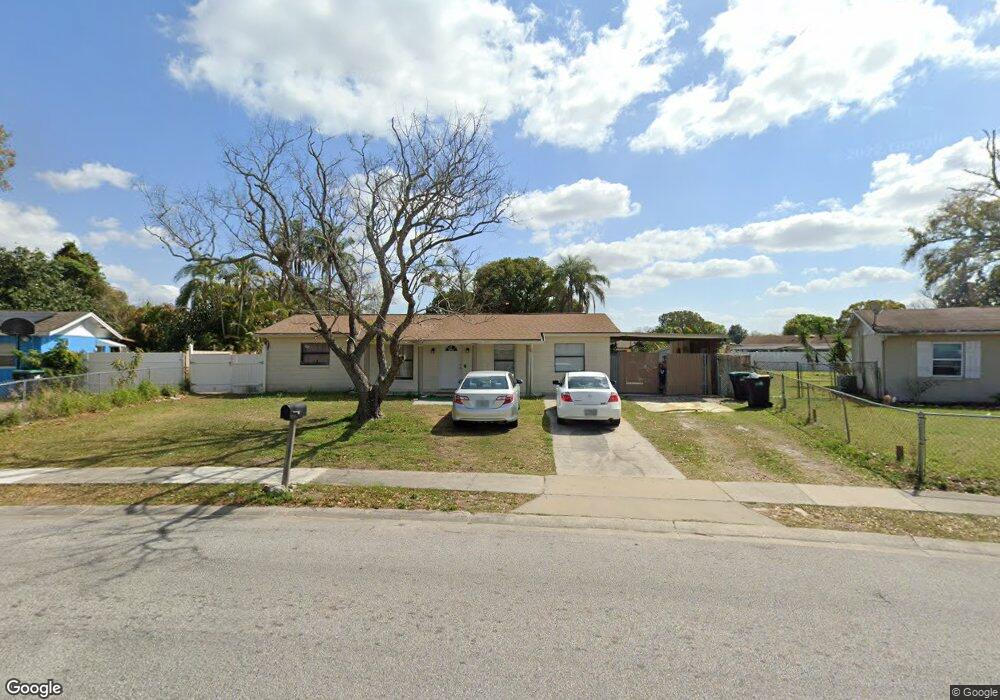
6745 Millay Dr Orlando, FL 32809
Estimated Value: $308,198 - $329,000
3
Beds
2
Baths
1,126
Sq Ft
$282/Sq Ft
Est. Value
About This Home
This home is located at 6745 Millay Dr, Orlando, FL 32809 and is currently estimated at $317,050, approximately $281 per square foot. 6745 Millay Dr is a home located in Orange County with nearby schools including Lancaster Elementary School, Judson B Walker Middle School, and Oak Ridge High School.
Ownership History
Date
Name
Owned For
Owner Type
Purchase Details
Closed on
Aug 15, 2016
Sold by
Arencibia Berrerdino and Arencibia Bernard
Bought by
Rosell Angel Armando
Current Estimated Value
Home Financials for this Owner
Home Financials are based on the most recent Mortgage that was taken out on this home.
Original Mortgage
$120,510
Outstanding Balance
$96,060
Interest Rate
3.45%
Mortgage Type
New Conventional
Estimated Equity
$220,990
Purchase Details
Closed on
Jan 4, 2016
Sold by
Property Disbursement Llc
Bought by
Arencibia Bernardino and Arencibia Bernard
Purchase Details
Closed on
Nov 4, 2015
Sold by
The Bank Of New York Mellon
Bought by
Property Disbursement Llc
Purchase Details
Closed on
Oct 28, 2014
Sold by
Seaman Debra M
Bought by
The Bank Of New York Mellon
Create a Home Valuation Report for This Property
The Home Valuation Report is an in-depth analysis detailing your home's value as well as a comparison with similar homes in the area
Home Values in the Area
Average Home Value in this Area
Purchase History
| Date | Buyer | Sale Price | Title Company |
|---|---|---|---|
| Rosell Angel Armando | $133,900 | Saint Lawrence Title Inc | |
| Arencibia Bernardino | $80,000 | Titlecorp Of America Llc | |
| Property Disbursement Llc | $80,000 | Genesis Title Company | |
| The Bank Of New York Mellon | $67,400 | None Available |
Source: Public Records
Mortgage History
| Date | Status | Borrower | Loan Amount |
|---|---|---|---|
| Open | Rosell Angel Armando | $120,510 |
Source: Public Records
Tax History
| Year | Tax Paid | Tax Assessment Tax Assessment Total Assessment is a certain percentage of the fair market value that is determined by local assessors to be the total taxable value of land and additions on the property. | Land | Improvement |
|---|---|---|---|---|
| 2025 | $4,224 | $246,810 | $80,000 | $166,810 |
| 2024 | $3,494 | $231,630 | -- | -- |
| 2023 | $3,494 | $229,633 | $80,000 | $149,633 |
| 2022 | $3,035 | $185,645 | $60,000 | $125,645 |
| 2021 | $2,752 | $158,206 | $55,000 | $103,206 |
| 2020 | $2,533 | $150,129 | $45,000 | $105,129 |
| 2019 | $2,472 | $138,307 | $40,000 | $98,307 |
| 2018 | $2,325 | $127,662 | $32,000 | $95,662 |
| 2017 | $2,203 | $119,457 | $25,000 | $94,457 |
| 2016 | $1,942 | $102,733 | $23,000 | $79,733 |
| 2015 | $2,398 | $90,331 | $23,000 | $67,331 |
| 2014 | $1,747 | $85,672 | $25,000 | $60,672 |
Source: Public Records
Map
Nearby Homes
- 555 Thomas Jefferson Way
- 6729 Ovid Ave
- 6774 Paul Revere Ct
- 710 Mcdougall Ct Unit H710
- 820 Orwell Ave
- 732 Mcdougall Ct
- 738 Ridenhour Cir Unit L
- 802 Sky Lake Cir Unit C
- 778 Ridenhour Cir Unit J778
- 6410 Cherry Grove Cir
- 6673 Bouganvillea Crescent Dr
- 6503 Brockbank Dr
- 845 Sky Lake Cir Unit D
- 7618 Brockbank Dr
- 6767 Cherry Grove Cir
- 1126 Orwell Ave
- 207 E Lancaster Rd
- 318 Sikes Ct
- 303 E Lancaster Rd
- 7314 Boice St
- 634 Marot St
- 6741 Millay Dr
- 6750 Oman Ct
- 635 Thomas Jefferson Way
- 623 Thomas Jefferson Way
- 655 Thomas Jefferson Way
- 654 Marot St
- 615 Thomas Jefferson Way
- 6738 Millay Dr
- 6737 Millay Dr
- 6748 Oman Ct
- 655 Marot St
- 6756 Oman Ct
- 663 Thomas Jefferson Way
- 597 Thomas Jefferson Way
- 662 Marot St
- 6723 Millay Dr
- 6736 Oman Ct
- 638 Marquand St
- 622 Thomas Jefferson Way
Your Personal Tour Guide
Ask me questions while you tour the home.