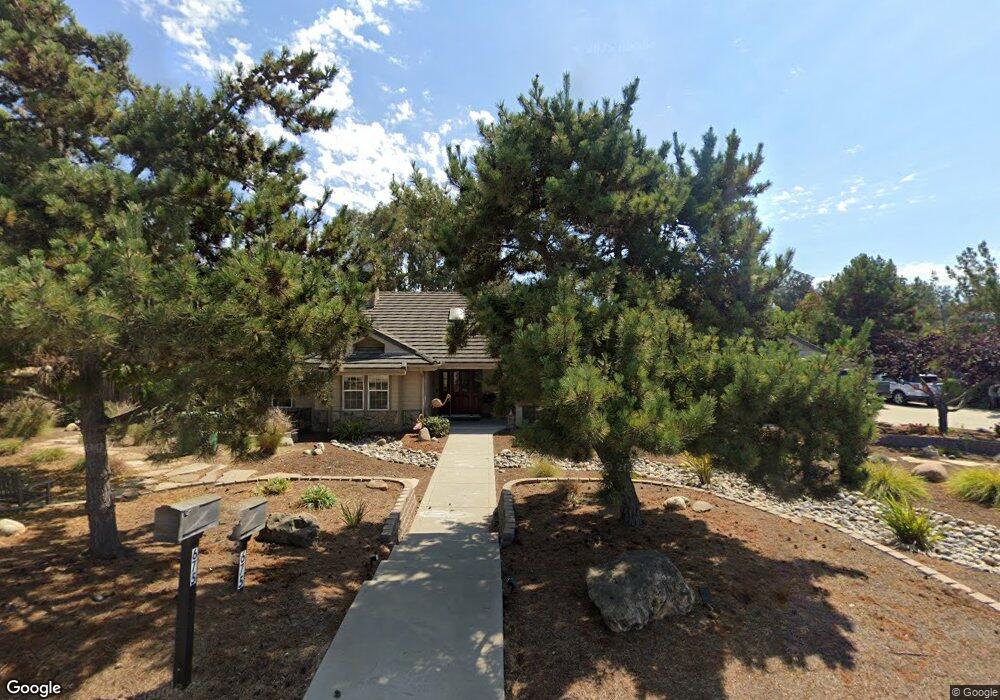
675 Camino Roble Nipomo, CA 93444
Estimated Value: $1,150,000 - $1,572,000
4
Beds
4
Baths
2,500
Sq Ft
$534/Sq Ft
Est. Value
About This Home
This home is located at 675 Camino Roble, Nipomo, CA 93444 and is currently estimated at $1,334,276, approximately $533 per square foot. 675 Camino Roble is a home located in San Luis Obispo County with nearby schools including Dana Elementary School, Mesa Middle School, and Nipomo High School.
Ownership History
Date
Name
Owned For
Owner Type
Purchase Details
Closed on
Dec 11, 2006
Sold by
Fiske Carey L
Bought by
Fiske Carey
Current Estimated Value
Home Financials for this Owner
Home Financials are based on the most recent Mortgage that was taken out on this home.
Original Mortgage
$325,000
Outstanding Balance
$194,956
Interest Rate
6.37%
Mortgage Type
New Conventional
Estimated Equity
$1,139,320
Purchase Details
Closed on
Feb 16, 2005
Sold by
Smith Carey Fiske
Bought by
Fiske Carey L
Home Financials for this Owner
Home Financials are based on the most recent Mortgage that was taken out on this home.
Original Mortgage
$290,000
Interest Rate
5.73%
Mortgage Type
New Conventional
Purchase Details
Closed on
Mar 9, 2000
Sold by
Rogers Homes Inc
Bought by
Smith Carey Fiske
Home Financials for this Owner
Home Financials are based on the most recent Mortgage that was taken out on this home.
Original Mortgage
$200,000
Interest Rate
8.34%
Create a Home Valuation Report for This Property
The Home Valuation Report is an in-depth analysis detailing your home's value as well as a comparison with similar homes in the area
Home Values in the Area
Average Home Value in this Area
Purchase History
| Date | Buyer | Sale Price | Title Company |
|---|---|---|---|
| Fiske Carey | -- | United General Title Ins Co | |
| Fiske Carey L | -- | Cuesta Title Company | |
| Smith Carey Fiske | $389,000 | Fidelity National Title Co |
Source: Public Records
Mortgage History
| Date | Status | Borrower | Loan Amount |
|---|---|---|---|
| Open | Fiske Carey | $325,000 | |
| Closed | Fiske Carey L | $290,000 | |
| Closed | Smith Carey Fiske | $200,000 |
Source: Public Records
Tax History Compared to Growth
Tax History
| Year | Tax Paid | Tax Assessment Tax Assessment Total Assessment is a certain percentage of the fair market value that is determined by local assessors to be the total taxable value of land and additions on the property. | Land | Improvement |
|---|---|---|---|---|
| 2025 | $6,076 | $597,869 | $245,906 | $351,963 |
| 2024 | $6,005 | $586,147 | $241,085 | $345,062 |
| 2023 | $6,005 | $574,655 | $236,358 | $338,297 |
| 2022 | $5,913 | $563,388 | $231,724 | $331,664 |
| 2021 | $5,901 | $552,342 | $227,181 | $325,161 |
| 2020 | $5,833 | $546,679 | $224,852 | $321,827 |
| 2019 | $5,795 | $535,961 | $220,444 | $315,517 |
| 2018 | $5,725 | $525,453 | $216,122 | $309,331 |
| 2017 | $5,616 | $515,151 | $211,885 | $303,266 |
| 2016 | $5,295 | $505,051 | $207,731 | $297,320 |
| 2015 | $5,218 | $497,465 | $204,611 | $292,854 |
| 2014 | $5,023 | $487,721 | $200,603 | $287,118 |
Source: Public Records
Map
Nearby Homes
- 620 Camino Roble
- 615 Sweet Donna Place
- 7855 Suey Creek Rd
- 1010 1012 Upper Los Berros Rd
- 875 Camino Caballo
- 219 Lema Dr
- 217 Hope Way
- 231 Trevino Dr
- 228 Chaparral Ln
- 759 Viola Ct
- 255 Encino Ln
- 940 Calle Fresa
- 261 Hazel Ln
- 719 W Tefft St
- 680 Hill St
- Mesa Plan at Hill Street Terraces - Hill Street Series
- Pacific Plan at Hill Street Terraces - Hill Street Series
- Monarch Plan at Hill Street Terraces - Hill Street Series
- Rancho Plan at Hill Street Terraces - Hill Street Series
- Dana Plan at Hill Street Terraces - Hill Street Series
- 1045 Camino Codorniz
- 655 Camino Roble
- 640 Sweet Donna Place
- 695 Camino Roble
- 630 Sweet Donna Place
- 660 Camino Roble
- 680 Camino Roble
- 640 Camino Roble
- 630 Camino Roble
- 610 Sweet Donna Place
- 625 Camino Roble
- 935 Camino Caballo
- 1050 Camino Codorniz
- 933 Camino Caballo
- 1020 Camino Codorniz
- 635 Sweet Donna Place
- 1080 Camino Codorniz
- 931 Camino Caballo
- 645 Sweet Donna Place
- 660 Sweet Donna Place