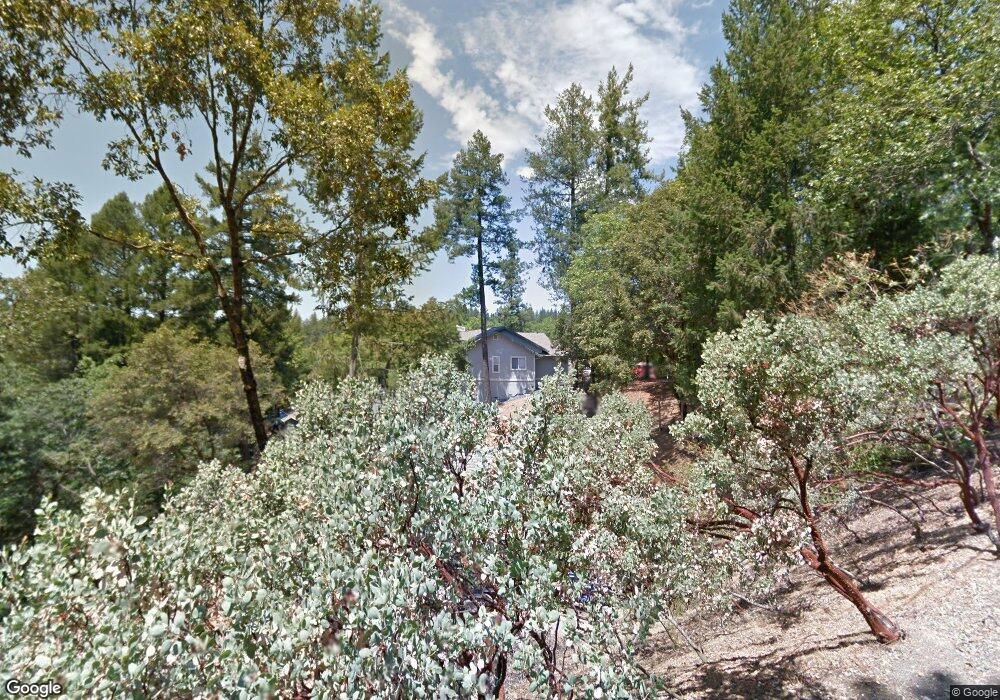
675 Caruso Ct Colfax, CA 95713
Estimated Value: $532,000 - $654,000
3
Beds
3
Baths
2,311
Sq Ft
$258/Sq Ft
Est. Value
About This Home
This home is located at 675 Caruso Ct, Colfax, CA 95713 and is currently estimated at $595,863, approximately $257 per square foot. 675 Caruso Ct is a home located in Placer County with nearby schools including Colfax Elementary School and Colfax High School.
Ownership History
Date
Name
Owned For
Owner Type
Purchase Details
Closed on
Aug 23, 2002
Sold by
Alexander Robin A and Jakobsen Steven D
Bought by
Jakobsen Steven D and Alexander Robin A
Current Estimated Value
Home Financials for this Owner
Home Financials are based on the most recent Mortgage that was taken out on this home.
Original Mortgage
$200,000
Interest Rate
6.43%
Mortgage Type
Balloon
Purchase Details
Closed on
Nov 12, 1998
Sold by
Alexander Robin A and Jakobsen Steven D
Bought by
Jakobsen Steven D and Alexander Robin A
Purchase Details
Closed on
Jan 17, 1996
Sold by
Smith Dean L and Smith Janice E
Bought by
Alexander Robin A and Jakobsen Steven D
Home Financials for this Owner
Home Financials are based on the most recent Mortgage that was taken out on this home.
Original Mortgage
$200,000
Interest Rate
7.18%
Mortgage Type
Purchase Money Mortgage
Create a Home Valuation Report for This Property
The Home Valuation Report is an in-depth analysis detailing your home's value as well as a comparison with similar homes in the area
Home Values in the Area
Average Home Value in this Area
Purchase History
| Date | Buyer | Sale Price | Title Company |
|---|---|---|---|
| Jakobsen Steven D | -- | Placer Title Company | |
| Alexander Robin A | -- | Placer Title Company | |
| Jakobsen Steven D | -- | -- | |
| Alexander Robin A | $250,000 | Old Republic Title Company |
Source: Public Records
Mortgage History
| Date | Status | Borrower | Loan Amount |
|---|---|---|---|
| Closed | Alexander Robin A | $200,000 | |
| Previous Owner | Alexander Robin A | $200,000 |
Source: Public Records
Tax History Compared to Growth
Tax History
| Year | Tax Paid | Tax Assessment Tax Assessment Total Assessment is a certain percentage of the fair market value that is determined by local assessors to be the total taxable value of land and additions on the property. | Land | Improvement |
|---|---|---|---|---|
| 2025 | $4,250 | $415,280 | $107,965 | $307,315 |
| 2023 | $4,250 | $399,157 | $103,774 | $295,383 |
| 2022 | $4,114 | $391,332 | $101,740 | $289,592 |
| 2021 | $4,026 | $383,660 | $99,746 | $283,914 |
| 2020 | $3,980 | $379,727 | $98,724 | $281,003 |
| 2019 | $3,902 | $372,283 | $96,789 | $275,494 |
| 2018 | $3,765 | $364,985 | $94,892 | $270,093 |
| 2017 | $3,698 | $357,830 | $93,032 | $264,798 |
| 2016 | $3,620 | $350,814 | $91,208 | $259,606 |
| 2015 | $3,462 | $345,545 | $89,838 | $255,707 |
| 2014 | $3,408 | $338,778 | $88,079 | $250,699 |
Source: Public Records
Map
Nearby Homes
- 416 Rubicon Ct
- 1124 Sierra Oaks Dr
- 508 Chase Ct
- 70 Iowa Hill Rd
- 24275 Grand View Ave
- 212 Glendale Rd
- 1836 Canyon Way
- 7-Acres Canyon Way
- 309 S Auburn St
- 155 Whitcomb Ave
- 24580 View Cape Horn Ave
- 1366 Oak Ridge Dr
- 34 Washington
- 38 Lincoln St
- 30 Lincoln St
- 147 Scholtz Ave
- 150 W Oak St
- 0 Kneeland St Unit 225109849
- 9 Rising Sun Rd
- 230 Rising Sun Rd