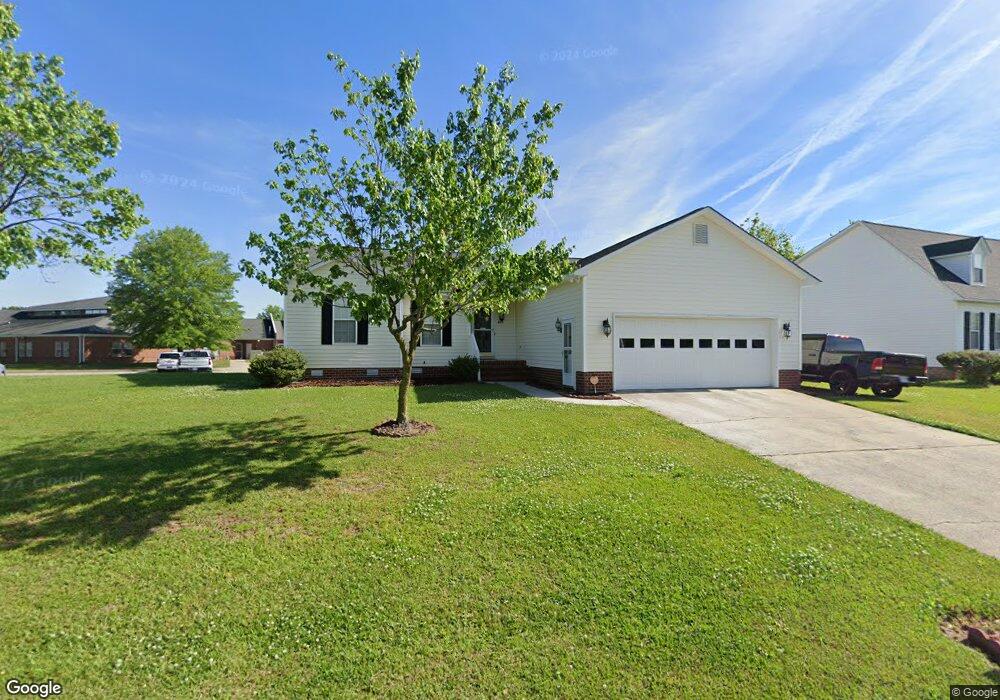
675 E Main St Winterville, NC 28590
Estimated Value: $221,000 - $270,257
3
Beds
2
Baths
1,561
Sq Ft
$161/Sq Ft
Est. Value
About This Home
This home is located at 675 E Main St, Winterville, NC 28590 and is currently estimated at $251,314, approximately $160 per square foot. 675 E Main St is a home located in Pitt County with nearby schools including W.H. Robinson Elementary School, A.G. Cox Middle School, and South Central High School.
Ownership History
Date
Name
Owned For
Owner Type
Purchase Details
Closed on
Apr 30, 2009
Sold by
Mclean Richard Anthony and Mclean Felicia
Bought by
Whitaker Percell L and Whitaker Jennifer S
Current Estimated Value
Home Financials for this Owner
Home Financials are based on the most recent Mortgage that was taken out on this home.
Original Mortgage
$147,050
Outstanding Balance
$93,707
Interest Rate
5.01%
Mortgage Type
VA
Estimated Equity
$157,607
Create a Home Valuation Report for This Property
The Home Valuation Report is an in-depth analysis detailing your home's value as well as a comparison with similar homes in the area
Home Values in the Area
Average Home Value in this Area
Purchase History
| Date | Buyer | Sale Price | Title Company |
|---|---|---|---|
| Whitaker Percell L | $143,000 | None Available |
Source: Public Records
Mortgage History
| Date | Status | Borrower | Loan Amount |
|---|---|---|---|
| Open | Whitaker Percell L | $147,050 |
Source: Public Records
Tax History
| Year | Tax Paid | Tax Assessment Tax Assessment Total Assessment is a certain percentage of the fair market value that is determined by local assessors to be the total taxable value of land and additions on the property. | Land | Improvement |
|---|---|---|---|---|
| 2025 | $1,751 | $256,862 | $40,000 | $216,862 |
| 2024 | $1,739 | $256,862 | $40,000 | $216,862 |
| 2023 | $1,429 | $176,948 | $22,000 | $154,948 |
| 2022 | $1,436 | $176,948 | $22,000 | $154,948 |
| 2021 | $1,429 | $176,948 | $22,000 | $154,948 |
| 2020 | $1,438 | $176,948 | $22,000 | $154,948 |
| 2019 | $1,245 | $150,656 | $20,000 | $130,656 |
| 2018 | $1,189 | $150,656 | $20,000 | $130,656 |
| 2017 | $1,189 | $150,656 | $20,000 | $130,656 |
| 2016 | $1,154 | $150,656 | $20,000 | $130,656 |
| 2015 | $1,154 | $149,112 | $20,000 | $129,112 |
| 2014 | $1,154 | $149,112 | $20,000 | $129,112 |
Source: Public Records
Map
Nearby Homes
- 4962 Old Tar Rd
- 2544 Amanda Place
- 523 Village Dr
- 561 Channel Dr
- 613 Brookfield Dr
- 2573 Graham St
- 330 Bethana Ct
- 527 Tabard Rd
- 655 Norberry Dr
- 2414 Glenda St
- 2221 Edgewater Dr
- 2812 Cresset Dr
- 2243 Black Horse Ln
- 911 Hunter Grace Dr
- 2585 Elis Dr
- 675 Stillwater Dr
- 2523 Jones St
- 2537 Jones St
- 2531 Jones St
- 946 Hunter Grace Dr
Your Personal Tour Guide
Ask me questions while you tour the home.