Estimated Value: $303,344 - $345,000
4
Beds
3
Baths
1,820
Sq Ft
$174/Sq Ft
Est. Value
About This Home
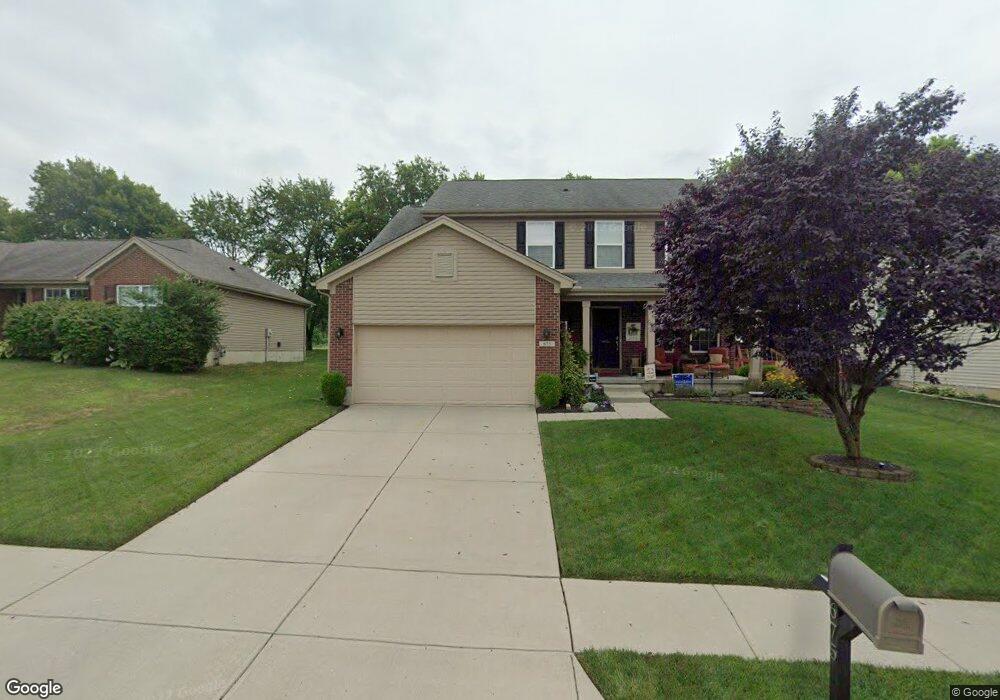
This home is located at 675 Jodee Dr, Xenia, OH 45385 and is currently estimated at $317,336, approximately $174 per square foot. 675 Jodee Dr is a home located in Greene County with nearby schools including Xenia High School and Summit Academy Community School for Alternative Learners - Xenia.
Ownership History
Date
Name
Owned For
Owner Type
Purchase Details
Closed on
Jul 26, 2012
Sold by
Bir Christopher A and Bir Christopher
Bought by
Bandergriff Brian
Current Estimated Value
Home Financials for this Owner
Home Financials are based on the most recent Mortgage that was taken out on this home.
Original Mortgage
$137,954
Outstanding Balance
$95,927
Interest Rate
3.75%
Mortgage Type
FHA
Estimated Equity
$221,409
Purchase Details
Closed on
Dec 17, 2008
Sold by
Inverness Group Incorporated
Bought by
Bir Christopher A and Bir Valerie R
Home Financials for this Owner
Home Financials are based on the most recent Mortgage that was taken out on this home.
Original Mortgage
$168,492
Interest Rate
5.96%
Mortgage Type
FHA
Purchase Details
Closed on
Aug 28, 2007
Sold by
Xenia Development Co Llc
Bought by
Inverness Group Inc
Home Financials for this Owner
Home Financials are based on the most recent Mortgage that was taken out on this home.
Original Mortgage
$20,000,000
Interest Rate
6.71%
Mortgage Type
Stand Alone Second
Create a Home Valuation Report for This Property
The Home Valuation Report is an in-depth analysis detailing your home's value as well as a comparison with similar homes in the area
Home Values in the Area
Average Home Value in this Area
Purchase History
| Date | Buyer | Sale Price | Title Company |
|---|---|---|---|
| Bandergriff Brian | $140,500 | None Available | |
| Bir Christopher A | $170,800 | Attorney | |
| Inverness Group Inc | -- | None Available |
Source: Public Records
Mortgage History
| Date | Status | Borrower | Loan Amount |
|---|---|---|---|
| Open | Bandergriff Brian | $137,954 | |
| Previous Owner | Bir Christopher A | $168,492 | |
| Previous Owner | Inverness Group Inc | $20,000,000 |
Source: Public Records
Tax History Compared to Growth
Tax History
| Year | Tax Paid | Tax Assessment Tax Assessment Total Assessment is a certain percentage of the fair market value that is determined by local assessors to be the total taxable value of land and additions on the property. | Land | Improvement |
|---|---|---|---|---|
| 2024 | $3,652 | $87,590 | $15,350 | $72,240 |
| 2023 | $3,652 | $87,590 | $15,350 | $72,240 |
| 2022 | $3,245 | $66,360 | $10,230 | $56,130 |
| 2021 | $3,289 | $66,360 | $10,230 | $56,130 |
| 2020 | $3,148 | $66,360 | $10,230 | $56,130 |
| 2019 | $2,615 | $51,900 | $8,330 | $43,570 |
| 2018 | $2,626 | $51,900 | $8,330 | $43,570 |
| 2017 | $2,560 | $51,900 | $8,330 | $43,570 |
| 2016 | $2,560 | $49,690 | $8,330 | $41,360 |
| 2015 | $2,568 | $49,690 | $8,330 | $41,360 |
| 2014 | $2,456 | $49,690 | $8,330 | $41,360 |
Source: Public Records
Map
Nearby Homes
- 2257 Maryland Dr
- 2545 Harmony Dr
- 2142 Michigan Dr
- 2345 Tennessee Dr
- 414 Whisper Ln
- 1107 Arkansas Dr
- 1829 Gayhart Dr
- 1908 Whitt St
- 1769 Gayhart Dr
- 1255 Colorado Dr
- 2499 Jenny Marie Dr
- 2421 Louisiana Dr
- 2540 Jenny Marie Dr
- 0 Berkshire Dr Unit 942854
- 1403 Texas Dr
- 219 Kansas Dr
- 1213 Prem Place
- 2758 Wyoming Dr
- 2540 Cornwall Dr
- 1866 Roxbury Dr