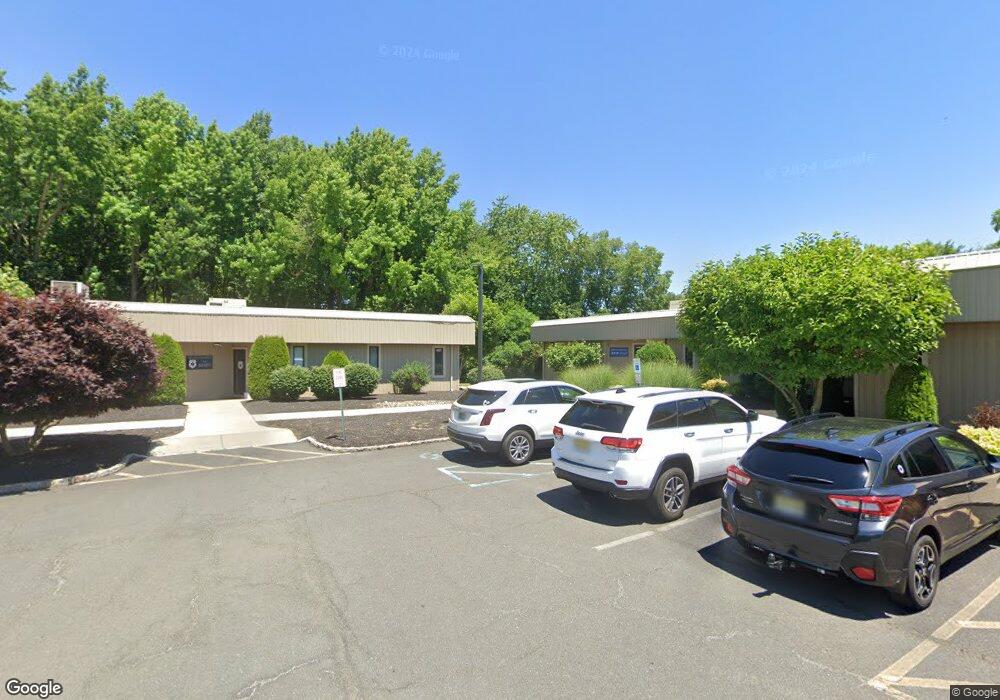
675 Line Rd Matawan, NJ 07747
Estimated Value: $2,756,202
--
Bed
--
Bath
18,600
Sq Ft
$148/Sq Ft
Est. Value
About This Home
This home is located at 675 Line Rd, Matawan, NJ 07747 and is currently estimated at $2,756,202, approximately $148 per square foot. 675 Line Rd is a home located in Monmouth County with nearby schools including Matawan Reg High School, St Benedict School, and St. Joseph Elementary School.
Ownership History
Date
Name
Owned For
Owner Type
Purchase Details
Closed on
Nov 29, 2021
Sold by
Fh Line Road Llc
Bought by
Lex 2021 Llc and J&C Ventures 2022 Llc
Current Estimated Value
Purchase Details
Closed on
Nov 18, 2008
Sold by
Lang Steven
Bought by
Fh Line Road Llc
Home Financials for this Owner
Home Financials are based on the most recent Mortgage that was taken out on this home.
Original Mortgage
$1,375,000
Interest Rate
6.03%
Mortgage Type
Commercial
Purchase Details
Closed on
Sep 16, 2005
Sold by
Steven Lang & Assoc
Bought by
Lang Steven
Purchase Details
Closed on
Sep 7, 2004
Sold by
Dickstein Richard E
Bought by
Steven Lang & Associates
Home Financials for this Owner
Home Financials are based on the most recent Mortgage that was taken out on this home.
Original Mortgage
$1,000,000
Interest Rate
5.56%
Mortgage Type
Commercial
Create a Home Valuation Report for This Property
The Home Valuation Report is an in-depth analysis detailing your home's value as well as a comparison with similar homes in the area
Home Values in the Area
Average Home Value in this Area
Purchase History
| Date | Buyer | Sale Price | Title Company |
|---|---|---|---|
| Lex 2021 Llc | $2,070,000 | Quality Ttl & Abstract Agcy | |
| Fh Line Road Llc | $1,830,000 | Red Bank Title Agency Inc | |
| Lang Steven | -- | -- | |
| Steven Lang & Associates | $1,323,000 | -- |
Source: Public Records
Mortgage History
| Date | Status | Borrower | Loan Amount |
|---|---|---|---|
| Previous Owner | Fh Line Road Llc | $1,375,000 | |
| Previous Owner | Steven Lang & Associates | $1,000,000 |
Source: Public Records
Tax History Compared to Growth
Tax History
| Year | Tax Paid | Tax Assessment Tax Assessment Total Assessment is a certain percentage of the fair market value that is determined by local assessors to be the total taxable value of land and additions on the property. | Land | Improvement |
|---|---|---|---|---|
| 2025 | $40,644 | $1,935,500 | $719,100 | $1,216,400 |
| 2024 | $45,783 | $2,011,100 | $719,100 | $1,292,000 |
| 2023 | $45,783 | $2,140,400 | $719,100 | $1,421,300 |
| 2022 | $56,271 | $2,070,000 | $719,100 | $1,350,900 |
| 2021 | $56,271 | $2,081,800 | $719,100 | $1,362,700 |
| 2020 | $57,325 | $2,112,200 | $719,100 | $1,393,100 |
| 2019 | $56,816 | $2,033,500 | $719,100 | $1,314,400 |
| 2018 | $54,901 | $1,969,900 | $719,100 | $1,250,800 |
| 2017 | $52,564 | $1,912,800 | $719,100 | $1,193,700 |
| 2016 | $49,993 | $1,898,700 | $705,000 | $1,193,700 |
| 2015 | $50,172 | $1,829,100 | $705,000 | $1,124,100 |
| 2014 | $49,203 | $1,829,100 | $705,000 | $1,124,100 |
Source: Public Records
Map
Nearby Homes
- 570 Line Rd
- 70 Northland Ln
- 40 North Cir
- 30 Briscoe Terrace
- 9 Tralee Rd
- 46 Parkview Dr
- 557 Lloyd Rd Unit B
- 101 Cresci Blvd
- 3 Avondale Ln
- 2 Avondale Ln
- 7 Lucia Ct Unit 7
- 10 Deer St
- 14 Dolan Ave
- 160 Village Green Way
- 23 Mathiasen Place
- 627 Beers St
- 362 Broadway
- 47 Village Green Way
- 154 Lower Main St
- 22 Lower Main St