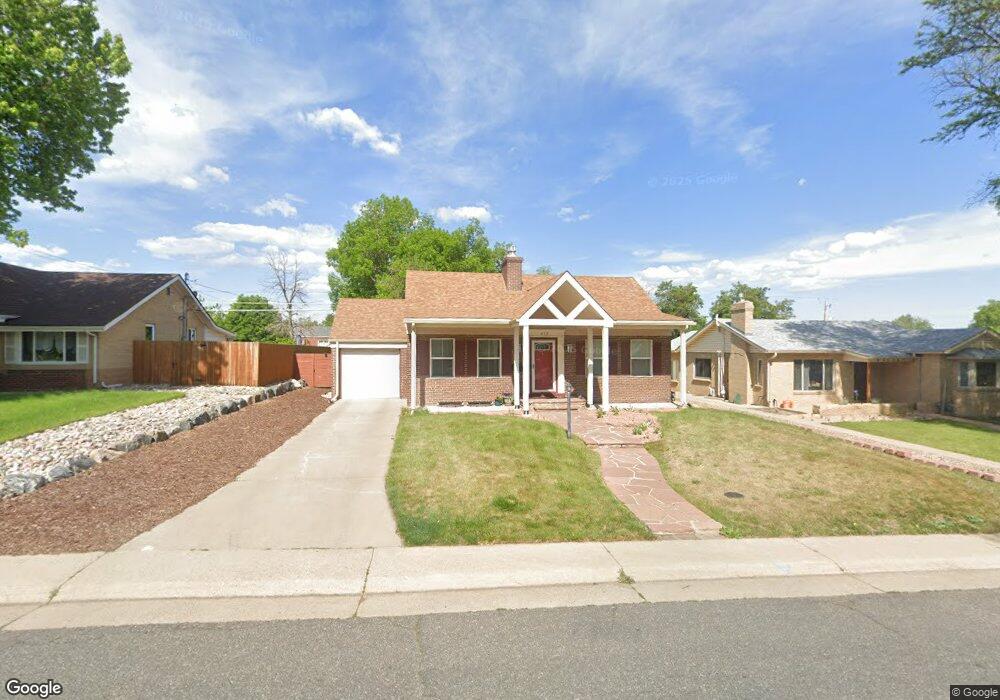
675 S Clay St Denver, CO 80219
Athmar Park NeighborhoodEstimated Value: $551,000 - $601,000
4
Beds
2
Baths
1,854
Sq Ft
$311/Sq Ft
Est. Value
About This Home
This home is located at 675 S Clay St, Denver, CO 80219 and is currently estimated at $575,684, approximately $310 per square foot. 675 S Clay St is a home located in Denver County with nearby schools including Goldrick Elementary School, Kepner Beacon Middle School, and West High School.
Ownership History
Date
Name
Owned For
Owner Type
Purchase Details
Closed on
Mar 14, 2017
Sold by
Ewing James
Bought by
Encinias Gabriela
Current Estimated Value
Purchase Details
Closed on
Jun 27, 2012
Sold by
Wollny Walter T
Bought by
Ewing James and Encinias Gabriela
Home Financials for this Owner
Home Financials are based on the most recent Mortgage that was taken out on this home.
Original Mortgage
$203,979
Interest Rate
3.75%
Mortgage Type
FHA
Purchase Details
Closed on
Dec 28, 2011
Sold by
Phh Mortgage Corporation
Bought by
Wollny Walter T
Purchase Details
Closed on
Sep 27, 2011
Sold by
Gibb Jason and Hasse Joanne F
Bought by
Phh Mortgage Corporation
Purchase Details
Closed on
Dec 30, 2003
Sold by
Allen John C and Allen Teresa A
Bought by
Gibb Jason and Hasse Joanne F
Home Financials for this Owner
Home Financials are based on the most recent Mortgage that was taken out on this home.
Original Mortgage
$191,900
Interest Rate
5.97%
Mortgage Type
Balloon
Purchase Details
Closed on
Feb 25, 1997
Sold by
Hoss George F and Hoss Julia M
Bought by
Allen John C and Allen Teresa A
Home Financials for this Owner
Home Financials are based on the most recent Mortgage that was taken out on this home.
Original Mortgage
$99,000
Interest Rate
7.92%
Create a Home Valuation Report for This Property
The Home Valuation Report is an in-depth analysis detailing your home's value as well as a comparison with similar homes in the area
Home Values in the Area
Average Home Value in this Area
Purchase History
| Date | Buyer | Sale Price | Title Company |
|---|---|---|---|
| Encinias Gabriela | -- | None Available | |
| Ewing James | $190,000 | None Available | |
| Wollny Walter T | $118,000 | Guardian Title Agency | |
| Phh Mortgage Corporation | -- | None Available | |
| Gibb Jason | $202,000 | Title America | |
| Allen John C | $110,000 | -- |
Source: Public Records
Mortgage History
| Date | Status | Borrower | Loan Amount |
|---|---|---|---|
| Previous Owner | Ewing James | $203,979 | |
| Previous Owner | Gibb Jason | $191,900 | |
| Previous Owner | Allen John C | $99,000 |
Source: Public Records
Tax History Compared to Growth
Tax History
| Year | Tax Paid | Tax Assessment Tax Assessment Total Assessment is a certain percentage of the fair market value that is determined by local assessors to be the total taxable value of land and additions on the property. | Land | Improvement |
|---|---|---|---|---|
| 2024 | $3,052 | $38,540 | $9,070 | $29,470 |
| 2023 | $2,986 | $38,540 | $9,070 | $29,470 |
| 2022 | $2,253 | $28,330 | $13,230 | $15,100 |
| 2021 | $2,174 | $29,140 | $13,610 | $15,530 |
| 2020 | $2,063 | $27,800 | $7,920 | $19,880 |
| 2019 | $2,005 | $27,800 | $7,920 | $19,880 |
| 2018 | $1,837 | $23,740 | $5,980 | $17,760 |
| 2017 | $1,831 | $23,740 | $5,980 | $17,760 |
| 2016 | $1,613 | $19,780 | $4,959 | $14,821 |
| 2015 | $1,545 | $19,780 | $4,959 | $14,821 |
| 2014 | $1,247 | $15,020 | $2,754 | $12,266 |
Source: Public Records
Map
Nearby Homes
- 737 S Clay St
- 601 S Dale Ct
- 695 S Bryant St
- 740 S Eliot St
- 527 S Bryant St
- 875 S Dale Ct
- 480 S Canosa Ct
- 3073 W Center Ave Unit A
- 3073 W Center Ave Unit C
- 2251 W Custer Place
- 980 S Dale Ct
- 2141 W Gill Place
- 3092 W Alaska Place
- 3174 W Center Ave
- 3145 W Ada Place
- 360 S Bryant St
- 2120 W Custer Place
- 3245 W Walsh Place
- 3228 W Virginia Ave
- 1055 S Bryant St