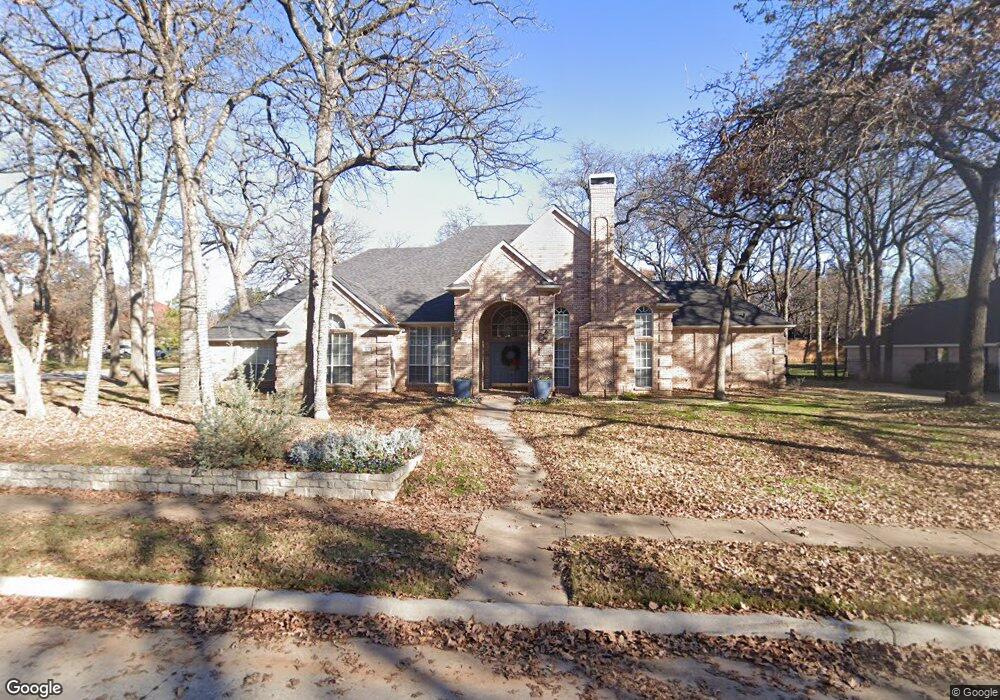
675 Southview Trail Southlake, TX 76092
Estimated Value: $935,723 - $1,021,000
3
Beds
3
Baths
2,667
Sq Ft
$360/Sq Ft
Est. Value
About This Home
This home is located at 675 Southview Trail, Southlake, TX 76092 and is currently estimated at $959,681, approximately $359 per square foot. 675 Southview Trail is a home located in Tarrant County with nearby schools including Walnut Grove Elementary School, Don T. Durham Intermediate School, and Carroll Middle School.
Ownership History
Date
Name
Owned For
Owner Type
Purchase Details
Closed on
Sep 28, 2020
Sold by
Gallagher Sheryl Ann and Marilyn Van Son Trust
Bought by
Malkiewicz Steven Mark and Malkiewicz Kimberly F
Current Estimated Value
Home Financials for this Owner
Home Financials are based on the most recent Mortgage that was taken out on this home.
Original Mortgage
$510,400
Outstanding Balance
$453,974
Interest Rate
2.9%
Mortgage Type
New Conventional
Estimated Equity
$505,707
Purchase Details
Closed on
Oct 11, 2017
Sold by
Son Marilyn Jeanne Vanj
Bought by
Vanson Marilyn Jeanne and The Marilyn Van Son Trust
Purchase Details
Closed on
May 8, 2017
Sold by
Vanson Marilyn J
Bought by
Vanson Marilyn Jeanne and Vanson Van Son
Create a Home Valuation Report for This Property
The Home Valuation Report is an in-depth analysis detailing your home's value as well as a comparison with similar homes in the area
Home Values in the Area
Average Home Value in this Area
Purchase History
| Date | Buyer | Sale Price | Title Company |
|---|---|---|---|
| Malkiewicz Steven Mark | -- | None Available | |
| Vanson Marilyn Jeanne | -- | None Available | |
| Vanson Marilyn Jeanne | -- | None Available |
Source: Public Records
Mortgage History
| Date | Status | Borrower | Loan Amount |
|---|---|---|---|
| Open | Malkiewicz Steven Mark | $510,400 |
Source: Public Records
Tax History Compared to Growth
Tax History
| Year | Tax Paid | Tax Assessment Tax Assessment Total Assessment is a certain percentage of the fair market value that is determined by local assessors to be the total taxable value of land and additions on the property. | Land | Improvement |
|---|---|---|---|---|
| 2025 | $10,334 | $880,234 | $375,030 | $505,204 |
| 2024 | $10,334 | $880,234 | $375,030 | $505,204 |
| 2023 | $13,232 | $956,452 | $375,030 | $581,422 |
| 2022 | $14,239 | $690,117 | $250,025 | $440,092 |
| 2021 | $13,680 | $599,986 | $250,025 | $349,961 |
| 2020 | $12,604 | $548,337 | $225,045 | $323,292 |
| 2019 | $12,943 | $534,496 | $150,000 | $384,496 |
| 2018 | $4,708 | $494,953 | $150,000 | $344,953 |
| 2017 | $11,181 | $518,647 | $150,000 | $368,647 |
| 2016 | $10,164 | $442,782 | $150,000 | $292,782 |
| 2015 | $4,571 | $372,800 | $40,000 | $332,800 |
| 2014 | $4,571 | $372,800 | $40,000 | $332,800 |
Source: Public Records
Map
Nearby Homes
- 806 Ownby Ln
- 2300 Highway 114 Rd
- 807 Cross Ln
- 1032 Rosavine Dr
- 1028 Rosavine Dr
- 1017 Rosavine Dr
- 1004 Rosavine Dr
- 1020 Rosavine Dr
- 1012 Rosavine Dr
- 1024 Rosavine Dr
- 1005 Rosavine Dr
- 1016 Rosavine Dr
- 1008 Rosavine Dr
- 350 Central Ave Unit 202
- 350 Central Ave Unit 503
- 350 Central Ave Unit 201
- 350 Central Ave Unit 307
- 350 Central Ave Unit 310
- 711 Saratoga Dr
- 231 Park Ridge Blvd
- 625 Southview Trail
- 920 Southview Trail
- 925 Southcrest Ct
- 650 Southview Trail
- 925 Southview Trail
- 825 Southview Trail
- 670 Southview Trail
- 575 Southview Trail
- 950 Southview Trail
- 955 Southcrest Ct
- 620 Southview Trail
- 920 Southcrest Ct
- 875 Lake Wood Dr
- 975 Southview Trail
- 555 Southview Trail
- 970 Southview Trail
- 925 Lakewood Dr
- 725 Bentwood Ln
- 975 Southcrest Ct
- 950 Southcrest Ct