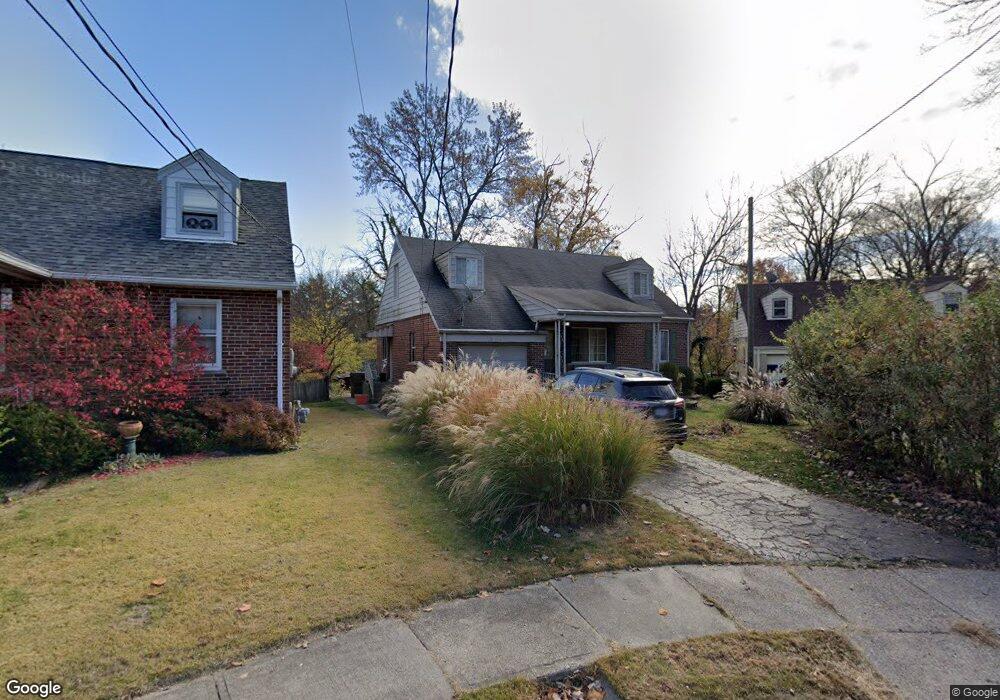
6752 Tarawa Dr Cincinnati, OH 45224
Estimated Value: $189,000 - $247,000
4
Beds
2
Baths
1,782
Sq Ft
$123/Sq Ft
Est. Value
About This Home
This home is located at 6752 Tarawa Dr, Cincinnati, OH 45224 and is currently estimated at $220,023, approximately $123 per square foot. 6752 Tarawa Dr is a home located in Hamilton County with nearby schools including North College Hill Elementary School, North College Hill Middle School, and North College Hill High School.
Ownership History
Date
Name
Owned For
Owner Type
Purchase Details
Closed on
Dec 14, 2004
Sold by
Wickemeier Thomas E and Wickemeier Kristine M
Bought by
Tolliver Jeri A
Current Estimated Value
Home Financials for this Owner
Home Financials are based on the most recent Mortgage that was taken out on this home.
Original Mortgage
$127,000
Outstanding Balance
$62,626
Interest Rate
5.5%
Mortgage Type
New Conventional
Estimated Equity
$157,397
Purchase Details
Closed on
Jul 30, 2004
Sold by
Walpole Marilyn C
Bought by
Wickemeier Thomas E and Wickemeier Kristine M
Home Financials for this Owner
Home Financials are based on the most recent Mortgage that was taken out on this home.
Original Mortgage
$40,000
Interest Rate
6.35%
Mortgage Type
Fannie Mae Freddie Mac
Purchase Details
Closed on
Feb 24, 1997
Sold by
Walpole Mark H
Bought by
Walpole Marilyn C
Home Financials for this Owner
Home Financials are based on the most recent Mortgage that was taken out on this home.
Original Mortgage
$52,500
Interest Rate
7.93%
Create a Home Valuation Report for This Property
The Home Valuation Report is an in-depth analysis detailing your home's value as well as a comparison with similar homes in the area
Home Values in the Area
Average Home Value in this Area
Purchase History
| Date | Buyer | Sale Price | Title Company |
|---|---|---|---|
| Tolliver Jeri A | $127,000 | Advanced Land Title Agency L | |
| Wickemeier Thomas E | $60,500 | Classic Title Agency Llc | |
| Walpole Marilyn C | -- | -- |
Source: Public Records
Mortgage History
| Date | Status | Borrower | Loan Amount |
|---|---|---|---|
| Open | Tolliver Jeri A | $127,000 | |
| Previous Owner | Wickemeier Thomas E | $40,000 | |
| Previous Owner | Walpole Marilyn C | $52,500 |
Source: Public Records
Tax History Compared to Growth
Tax History
| Year | Tax Paid | Tax Assessment Tax Assessment Total Assessment is a certain percentage of the fair market value that is determined by local assessors to be the total taxable value of land and additions on the property. | Land | Improvement |
|---|---|---|---|---|
| 2024 | $2,464 | $48,696 | $8,120 | $40,576 |
| 2023 | $2,486 | $48,696 | $8,120 | $40,576 |
| 2022 | $1,999 | $27,952 | $6,864 | $21,088 |
| 2021 | $1,956 | $27,952 | $6,864 | $21,088 |
| 2020 | $1,716 | $27,952 | $6,864 | $21,088 |
| 2019 | $1,681 | $24,518 | $6,020 | $18,498 |
| 2018 | $1,681 | $24,518 | $6,020 | $18,498 |
| 2017 | $1,587 | $24,518 | $6,020 | $18,498 |
| 2016 | $1,898 | $31,052 | $7,798 | $23,254 |
| 2015 | $1,902 | $31,052 | $7,798 | $23,254 |
| 2014 | $1,900 | $31,052 | $7,798 | $23,254 |
| 2013 | $1,862 | $31,364 | $7,875 | $23,489 |
Source: Public Records
Map
Nearby Homes
- 6785 Marvin Ave
- 6765 Richard Ave
- 1562 Oak Knoll Dr
- 1566 Oak Knoll Dr
- 6820 Tarawa Dr
- 6531 Hamilton Ave
- 6543 Hamilton Ave
- 1544 W Galbraith Rd
- 1544 W Galbraith Rd Unit 503
- 1621 Sundale Ave
- 7929 Cherrywood Ct
- 6521 Meis Ave
- 6712 Park Place
- 1280 Brushwood Ave
- 1453 Larrywood Ln
- 1613 de Armand Ave
- 1549 Teakwood Ave
- 1634 Birchwood Ave
- 1586 W Galbraith Rd
- 1522 Wittekind Terrace
- 6748 Tarawa Dr
- 6756 Tarawa Dr
- 6760 Tarawa Dr
- 6779 Marvin Ave
- 1504 Oak Knoll Dr
- 6781 Marvin Ave
- 6764 Tarawa Dr
- 1500 Oak Knoll Dr
- 6783 Marvin Ave
- 6749 Tarawa Dr
- 1506 Oak Knoll Dr
- 6768 Tarawa Dr
- 6753 Tarawa Dr
- 6757 Tarawa Dr
- 6778 Marvin Ave
- 6772 Tarawa Dr
- 6780 Marvin Ave
- 6787 Marvin Ave
- 6761 Tarawa Dr
- 1472 Oak Knoll Dr