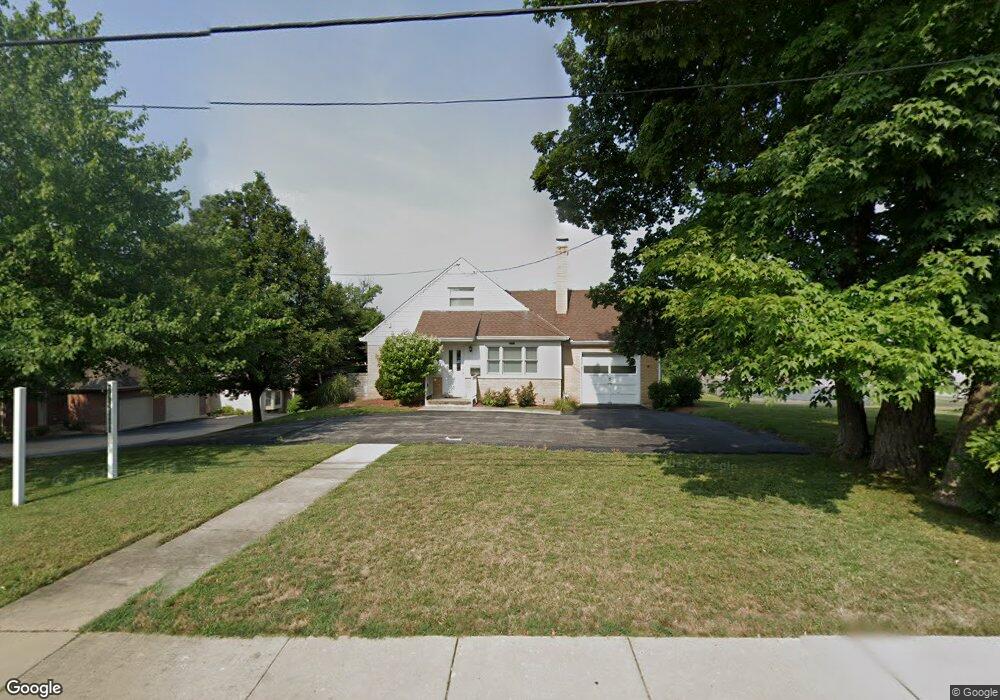
6753 Cheviot Rd Cincinnati, OH 45247
Estimated Value: $181,000 - $282,000
3
Beds
1
Bath
1,192
Sq Ft
$182/Sq Ft
Est. Value
About This Home
This home is located at 6753 Cheviot Rd, Cincinnati, OH 45247 and is currently estimated at $217,006, approximately $182 per square foot. 6753 Cheviot Rd is a home located in Hamilton County with nearby schools including Monfort Heights Elementary School, White Oak Middle School, and Colerain High School.
Ownership History
Date
Name
Owned For
Owner Type
Purchase Details
Closed on
Mar 3, 2023
Sold by
New Rich Properties Llc
Bought by
6753 Cheviot Rd Llc
Current Estimated Value
Purchase Details
Closed on
Jul 1, 2008
Sold by
Weddendorf Steven R and Weddendorf Sue Ann
Bought by
New Rich Properties Llc
Home Financials for this Owner
Home Financials are based on the most recent Mortgage that was taken out on this home.
Original Mortgage
$140,000
Interest Rate
5.96%
Mortgage Type
Future Advance Clause Open End Mortgage
Purchase Details
Closed on
Nov 30, 2000
Sold by
Bosse Joseph H and Bosse Michaelyn E
Bought by
Weddendorf Steven R and Weddendorf Sue Ann
Home Financials for this Owner
Home Financials are based on the most recent Mortgage that was taken out on this home.
Original Mortgage
$119,900
Interest Rate
7.86%
Create a Home Valuation Report for This Property
The Home Valuation Report is an in-depth analysis detailing your home's value as well as a comparison with similar homes in the area
Home Values in the Area
Average Home Value in this Area
Purchase History
| Date | Buyer | Sale Price | Title Company |
|---|---|---|---|
| 6753 Cheviot Rd Llc | $155,000 | None Listed On Document | |
| New Rich Properties Llc | $175,000 | Attorney | |
| Weddendorf Steven R | $149,900 | -- |
Source: Public Records
Mortgage History
| Date | Status | Borrower | Loan Amount |
|---|---|---|---|
| Previous Owner | New Rich Properties Llc | $140,000 | |
| Previous Owner | Weddendorf Steven R | $119,900 |
Source: Public Records
Tax History Compared to Growth
Tax History
| Year | Tax Paid | Tax Assessment Tax Assessment Total Assessment is a certain percentage of the fair market value that is determined by local assessors to be the total taxable value of land and additions on the property. | Land | Improvement |
|---|---|---|---|---|
| 2024 | $3,054 | $54,251 | $9,363 | $44,888 |
| 2023 | $3,019 | $54,251 | $9,363 | $44,888 |
| 2022 | $3,136 | $46,106 | $8,838 | $37,268 |
| 2021 | $3,166 | $46,106 | $8,838 | $37,268 |
| 2020 | $3,128 | $46,106 | $8,838 | $37,268 |
| 2019 | $2,856 | $39,074 | $7,490 | $31,584 |
| 2018 | $2,570 | $39,074 | $7,490 | $31,584 |
| 2017 | $2,469 | $39,074 | $7,490 | $31,584 |
| 2016 | $3,337 | $51,632 | $7,483 | $44,149 |
| 2015 | $3,322 | $51,632 | $7,483 | $44,149 |
| 2014 | $3,332 | $51,632 | $7,483 | $44,149 |
| 2013 | $3,342 | $54,348 | $7,875 | $46,473 |
Source: Public Records
Map
Nearby Homes
- 6705 Cheviot Rd Unit 3
- 3387 Lapland Dr
- 6893 Newbridge Dr
- 6321 Duet Ln
- 6195 Seiler Dr
- 7620 Cheviot Rd
- 3350 Melodymanor Dr
- 7030 King James Ct
- 3397 Nandale Dr
- 3250 March Terrace
- 3464 Nandale Dr Unit 53
- 6364 Oakcreek Dr
- 3927 Philnoll Dr
- 3329 Alexis Rd
- 5979 Fawnridge Ct
- 3398 Stevie Ln
- 3219 Banning Rd
- 3408 Rocker Dr
- 3691 W Galbraith Rd
- 3701 W Galbraith Rd
- 6709 Cheviot Rd Unit 5
- 6701 Cheviot Rd Unit 1
- 6707 Cheviot Rd Unit 4
- 6703 Cheviot Rd Unit 2
- 6709 Cheviot Rd
- 6724 Cheviot Rd
- 6681 Cheviot Rd
- 6708 Cheviot Rd
- 6738 Cheviot Rd
- 3603 Benhill Dr
- 3601 Benhill Dr
- 3605 Benhill Dr
- 6700 Cheviot Rd
- 6801 Cheviot Rd Unit 2
- 6801 Cheviot Rd Unit 1
- 6800 Cheviot Rd
- 3592 Riehle Rd
- 6816 Cheviot Rd
- 6719 Cheviot Rd
- 6717 Cheviot Rd