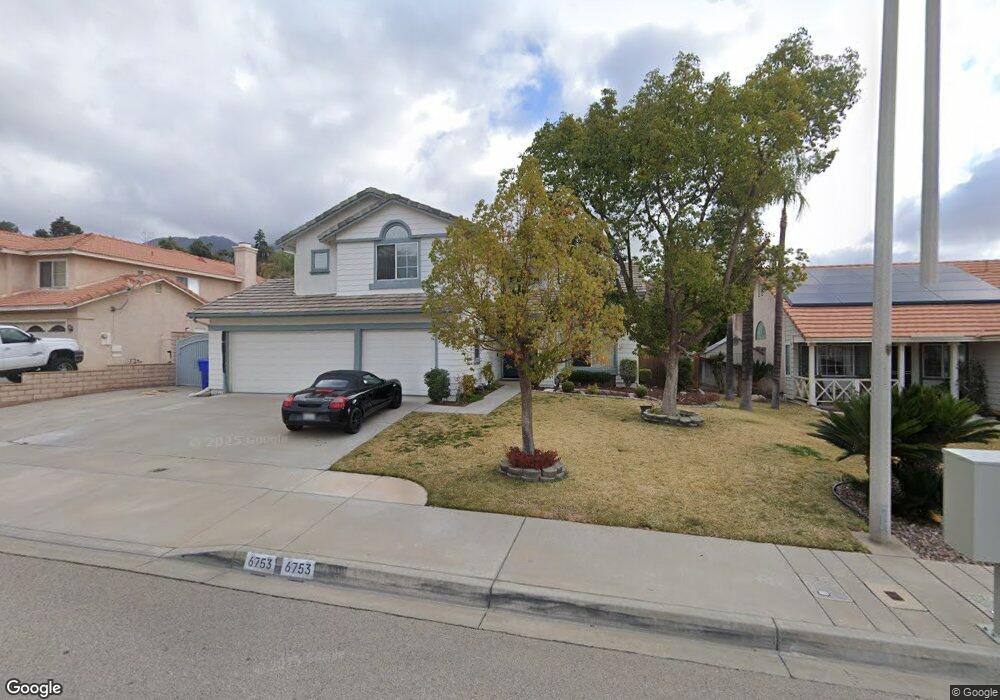
6753 Regal Oaks Rd Highland, CA 92346
East Highlands NeighborhoodEstimated Value: $602,147 - $690,000
5
Beds
3
Baths
2,244
Sq Ft
$292/Sq Ft
Est. Value
About This Home
This home is located at 6753 Regal Oaks Rd, Highland, CA 92346 and is currently estimated at $654,287, approximately $291 per square foot. 6753 Regal Oaks Rd is a home located in San Bernardino County with nearby schools including Thompson Elementary School, Serrano Middle School, and San Gorgonio High School.
Ownership History
Date
Name
Owned For
Owner Type
Purchase Details
Closed on
Nov 29, 2004
Sold by
Terbest Troy A and Terbest Pamela
Bought by
Terbest Troy A and Terbest Pamela
Current Estimated Value
Purchase Details
Closed on
Feb 9, 2000
Sold by
Fitts Eva J
Bought by
Terbest Troy Anthony and Terbest Pamela
Home Financials for this Owner
Home Financials are based on the most recent Mortgage that was taken out on this home.
Original Mortgage
$147,200
Outstanding Balance
$49,051
Interest Rate
8.27%
Estimated Equity
$605,236
Purchase Details
Closed on
Feb 18, 1999
Sold by
Jarvis David W
Bought by
Fitts Eva J
Purchase Details
Closed on
Mar 21, 1994
Sold by
Centex Real Estate Corp
Bought by
Jarvis David W and Fitts Eva J
Home Financials for this Owner
Home Financials are based on the most recent Mortgage that was taken out on this home.
Original Mortgage
$157,308
Interest Rate
7.84%
Create a Home Valuation Report for This Property
The Home Valuation Report is an in-depth analysis detailing your home's value as well as a comparison with similar homes in the area
Home Values in the Area
Average Home Value in this Area
Purchase History
| Date | Buyer | Sale Price | Title Company |
|---|---|---|---|
| Terbest Troy A | -- | -- | |
| Terbest Troy Anthony | $184,000 | Old Republic Title Company | |
| Fitts Eva J | -- | -- | |
| Jarvis David W | $166,000 | Stewart Title |
Source: Public Records
Mortgage History
| Date | Status | Borrower | Loan Amount |
|---|---|---|---|
| Open | Terbest Troy Anthony | $147,200 | |
| Previous Owner | Jarvis David W | $157,308 | |
| Closed | Terbest Troy Anthony | $18,400 |
Source: Public Records
Tax History Compared to Growth
Tax History
| Year | Tax Paid | Tax Assessment Tax Assessment Total Assessment is a certain percentage of the fair market value that is determined by local assessors to be the total taxable value of land and additions on the property. | Land | Improvement |
|---|---|---|---|---|
| 2025 | $3,927 | $282,804 | $73,775 | $209,029 |
| 2024 | $3,927 | $277,258 | $72,328 | $204,930 |
| 2023 | $3,837 | $271,822 | $70,910 | $200,912 |
| 2022 | $3,832 | $266,493 | $69,520 | $196,973 |
| 2021 | $3,793 | $261,268 | $68,157 | $193,111 |
| 2020 | $3,784 | $258,589 | $67,458 | $191,131 |
| 2019 | $3,655 | $253,518 | $66,135 | $187,383 |
| 2018 | $3,543 | $248,547 | $64,838 | $183,709 |
| 2017 | $3,188 | $243,674 | $63,567 | $180,107 |
| 2016 | $3,090 | $238,896 | $62,321 | $176,575 |
| 2015 | $3,141 | $235,308 | $61,385 | $173,923 |
| 2014 | $3,052 | $230,699 | $60,183 | $170,516 |
Source: Public Records
Map
Nearby Homes
- 28370 Coachman Ln
- 27953 Atlantic Ave
- 28037 Clifton St
- 27875 Rainbow Ln
- 28390 Burns Ave
- 27888 Rainbow Ln
- 0 Gala St
- 7223 Yarnell Rd
- 7214 Quail Run Dr
- 28680 Live Oak Rd
- 6941 La Praix St
- 0 Baseline St Unit CV25136921
- 0 La Praix St
- 28780 Beattie St
- 28817 Terrace Dr
- 27856 Fieldstone Dr
- 4040 Piedmont Dr Unit 81
- 4040 Piedmont Dr Unit 289
- 4040 Piedmont Dr Unit 297
- 4040 Piedmont Dr Unit 283
- 6741 Regal Oaks Rd
- 6767 Regal Oaks Rd
- 6756 Tiara Ave
- 6735 Regal Oaks Rd
- 6775 Regal Oaks Rd
- 6730 Tiara Ave
- 6768 Tiara Ave
- 6750 Regal Oaks Rd
- 6742 Regal Oaks Rd
- 6764 Regal Oaks Rd
- 6776 Tiara Ave
- 6722 Tiara Ave
- 6783 Regal Oaks Rd
- 6734 Regal Oaks Rd
- 6723 Regal Oaks Rd
- 6772 Regal Oaks Rd
- 6784 Tiara Ave
- 6728 Regal Oaks Rd
- 6784 Regal Oaks Rd
- 6807 Regal Oaks Rd