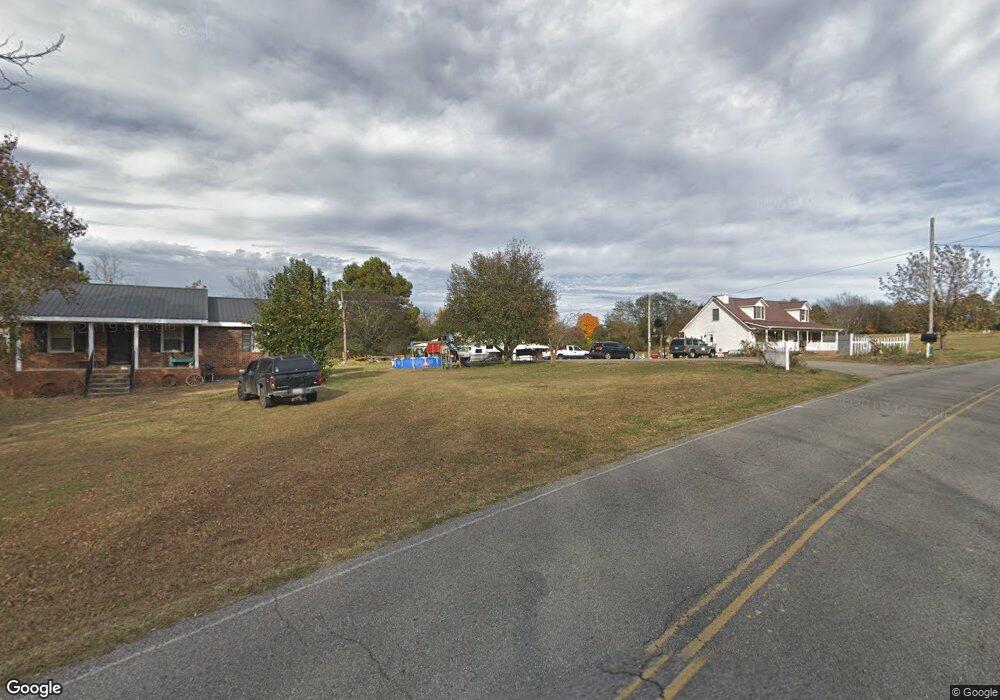
6754 Owens Chapel Rd Springfield, TN 37172
Estimated Value: $338,505 - $435,000
Studio
2
Baths
1,674
Sq Ft
$239/Sq Ft
Est. Value
About This Home
This home is located at 6754 Owens Chapel Rd, Springfield, TN 37172 and is currently estimated at $400,376, approximately $239 per square foot. 6754 Owens Chapel Rd is a home located in Robertson County with nearby schools including Krisle Elementary School and East Robertson High School.
Ownership History
Date
Name
Owned For
Owner Type
Purchase Details
Closed on
Oct 16, 1998
Sold by
Dean James K
Bought by
Myers David C and Myers Lynn C
Current Estimated Value
Purchase Details
Closed on
Nov 4, 1997
Sold by
Crump Daniel and Crump Marilyn
Bought by
Dean James K and Dean Sandra A
Purchase Details
Closed on
Oct 17, 1997
Sold by
Bogas Genevieve J
Bought by
Crump Daniel and Crump Marilyn
Purchase Details
Closed on
Oct 16, 1997
Sold by
Bogas Genevieve J
Bought by
Bogas Genevieve J
Purchase Details
Closed on
Aug 26, 1997
Sold by
Miller Robert Lee
Bought by
King Tony and King Rita
Purchase Details
Closed on
Jul 1, 1997
Sold by
Tewell Fred
Bought by
Miller Robert Lee
Purchase Details
Closed on
May 7, 1997
Bought by
Privette James and Privette Mary
Purchase Details
Closed on
Jun 17, 1994
Sold by
Pentecost Mary Marie Green
Bought by
Tewell Fred
Purchase Details
Closed on
Jun 16, 1989
Bought by
Hulsey Timmy J
Create a Home Valuation Report for This Property
The Home Valuation Report is an in-depth analysis detailing your home's value as well as a comparison with similar homes in the area
Home Values in the Area
Average Home Value in this Area
Purchase History
| Date | Buyer | Sale Price | Title Company |
|---|---|---|---|
| Myers David C | $109,500 | -- | |
| Dean James K | $35,000 | -- | |
| Crump Daniel | $23,000 | -- | |
| Bogas Genevieve J | $23,000 | -- | |
| King Tony | $22,000 | -- | |
| Miller Robert Lee | $26,900 | -- | |
| Privette James | $94,000 | -- | |
| Tewell Fred | -- | -- | |
| Hulsey Timmy J | -- | -- |
Source: Public Records
Tax History
| Year | Tax Paid | Tax Assessment Tax Assessment Total Assessment is a certain percentage of the fair market value that is determined by local assessors to be the total taxable value of land and additions on the property. | Land | Improvement |
|---|---|---|---|---|
| 2025 | $1,356 | $75,325 | $18,025 | $57,300 |
| 2024 | $1,356 | $75,325 | $18,025 | $57,300 |
| 2023 | $1,356 | $75,325 | $18,025 | $57,300 |
| 2022 | $1,503 | $58,350 | $9,325 | $49,025 |
| 2021 | $1,500 | $58,225 | $9,325 | $48,900 |
| 2020 | $1,500 | $58,225 | $9,325 | $48,900 |
| 2019 | $1,500 | $58,225 | $9,325 | $48,900 |
| 2018 | $1,500 | $58,225 | $9,325 | $48,900 |
| 2017 | $1,294 | $41,950 | $7,000 | $34,950 |
| 2016 | $1,294 | $41,950 | $7,000 | $34,950 |
| 2015 | $1,242 | $41,950 | $7,000 | $34,950 |
| 2014 | $1,242 | $41,950 | $7,000 | $34,950 |
Source: Public Records
Map
Nearby Homes
- 12354 Owens Chapel Rd
- 6808 Hester Rd
- 4031 Wells Rd
- 3941 Baggett Rd
- 3972 Baggett Rd
- 5031 Homer Worsham Rd
- 4616 Woodrow Wilson Rd
- 0 Homer Worsham Rd
- 4398 Woodrow Wilson Rd
- 1074 Pair Six Dr
- 4247 Armstrong Rd
- 4337 Woodrow Wilson Rd
- 316 Thoroughbred Way
- 7855 Bethlehem Rd
- 7193 Golden Way
- 0 Charles Dorris Rd
- 0 Pinson Rd
- 116 Pennsylvania Ave
- 9611 Cross Plains Rd
- 1004 Shiloh Dr
- 6705 Hester Rd
- 6752 Owens Chapel Rd
- 6753 Owens Chapel Rd
- 12719 Owens Chapel Rd
- 6707 Hester Rd
- 6680 Hester Rd
- 6797 Owens Chapel Rd
- 12848 Owens Chapel Rd
- 6662 Hester Rd
- 6660 Hester Rd
- 6664 Hester Rd
- 4062 Roy Cole Rd
- 6824 Owens Chapel Rd
- 6709 Hester Rd
- 6791 Owens Chapel Rd
- 4070 Roy Cole Rd
- 4023 Baggett Rd
- 12869 Owens Chapel Rd
- 12869 Owens Chapel Rd
- 4157 Wells Rd
Your Personal Tour Guide
Ask me questions while you tour the home.