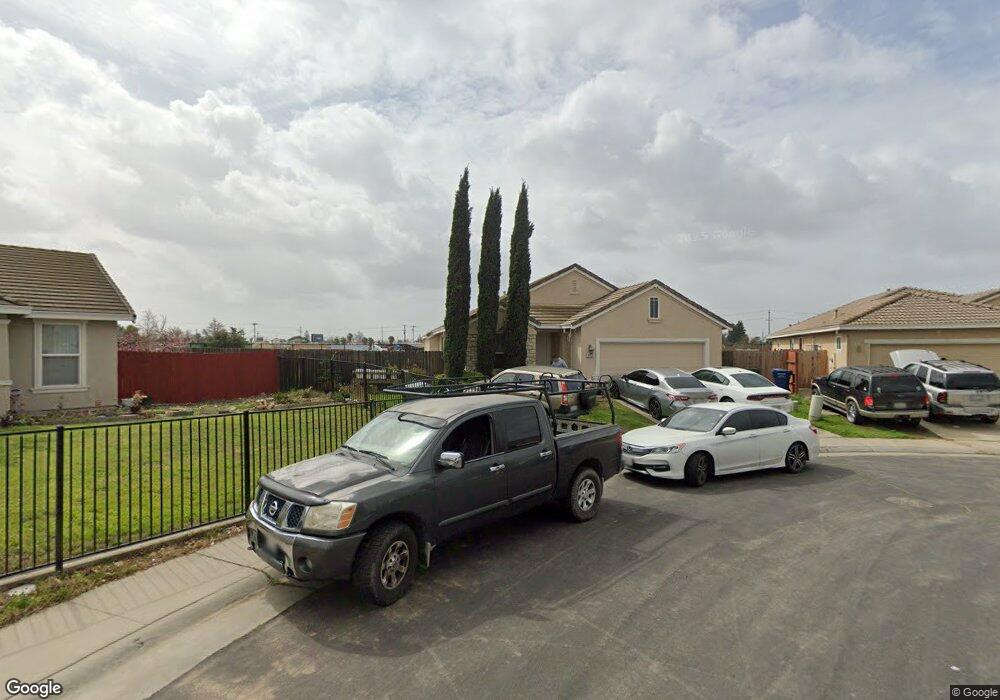
6754 Sandylee Way Sacramento, CA 95828
Estimated Value: $318,000 - $479,000
4
Beds
2
Baths
1,477
Sq Ft
$282/Sq Ft
Est. Value
About This Home
This home is located at 6754 Sandylee Way, Sacramento, CA 95828 and is currently estimated at $415,843, approximately $281 per square foot. 6754 Sandylee Way is a home located in Sacramento County with nearby schools including David Reese Elementary School, James Rutter Middle School, and Florin High School.
Ownership History
Date
Name
Owned For
Owner Type
Purchase Details
Closed on
Mar 18, 2015
Sold by
Ih2 Property West Lp
Bought by
2015-2 Ih2 Borrower Lp
Current Estimated Value
Purchase Details
Closed on
Aug 29, 2013
Sold by
Luna Natividad
Bought by
Ih2 Property West Lp
Purchase Details
Closed on
Oct 25, 2005
Sold by
Luna Jamie
Bought by
Luna Natvidad
Home Financials for this Owner
Home Financials are based on the most recent Mortgage that was taken out on this home.
Original Mortgage
$65,850
Interest Rate
5.93%
Mortgage Type
Stand Alone Second
Purchase Details
Closed on
Aug 17, 2005
Sold by
Beazer Homes Holdings Corp
Bought by
Luna Natividad
Home Financials for this Owner
Home Financials are based on the most recent Mortgage that was taken out on this home.
Original Mortgage
$263,500
Interest Rate
6.87%
Mortgage Type
Purchase Money Mortgage
Purchase Details
Closed on
Dec 16, 2003
Sold by
Martin Kathryn K
Bought by
Martin Gary W
Create a Home Valuation Report for This Property
The Home Valuation Report is an in-depth analysis detailing your home's value as well as a comparison with similar homes in the area
Home Values in the Area
Average Home Value in this Area
Purchase History
| Date | Buyer | Sale Price | Title Company |
|---|---|---|---|
| 2015-2 Ih2 Borrower Lp | -- | None Available | |
| Ih2 Property West Lp | $168,000 | Fnt | |
| Luna Natvidad | -- | Chicago Title Co | |
| Luna Natividad | $329,500 | Chicago Title Co | |
| Martin Gary W | -- | -- |
Source: Public Records
Mortgage History
| Date | Status | Borrower | Loan Amount |
|---|---|---|---|
| Previous Owner | Luna Natvidad | $65,850 | |
| Previous Owner | Luna Natividad | $263,500 |
Source: Public Records
Tax History Compared to Growth
Tax History
| Year | Tax Paid | Tax Assessment Tax Assessment Total Assessment is a certain percentage of the fair market value that is determined by local assessors to be the total taxable value of land and additions on the property. | Land | Improvement |
|---|---|---|---|---|
| 2025 | $3,313 | $290,140 | $81,238 | $208,902 |
| 2024 | $3,313 | $284,452 | $79,646 | $204,806 |
| 2023 | $3,233 | $278,876 | $78,085 | $200,791 |
| 2022 | $3,180 | $273,408 | $76,554 | $196,854 |
| 2021 | $3,147 | $268,048 | $75,053 | $192,995 |
| 2020 | $3,106 | $265,301 | $74,284 | $191,017 |
| 2019 | $3,052 | $260,100 | $72,828 | $187,272 |
| 2018 | $2,050 | $166,988 | $32,319 | $134,669 |
| 2017 | $2,018 | $163,715 | $31,686 | $132,029 |
| 2016 | $1,915 | $160,506 | $31,065 | $129,441 |
| 2015 | $1,883 | $158,096 | $30,599 | $127,497 |
| 2014 | $1,855 | $155,000 | $30,000 | $125,000 |
Source: Public Records
Map
Nearby Homes
- 7312 Del Prado Way
- 6944 Mirador Way
- 7548 Lindale Dr
- 7413 Skander Way
- 6400 66th Ave Unit 21
- 7548 Huckleberry Ln
- 7451 Albezzia Ln
- 7551 Red Bud Ln
- 6124 Pomegranate Ave
- 7206 Willowwest Ct
- 5906 Stacy Ave
- 7618 Sunvaught Ln
- 6837 Southwood Way
- 7566 Sunmore Ln
- 7020 Sunnyslope Dr
- 7633 Clement Cir
- 7605 Mctavish Cir
- 6104 Center Mall Way
- 7598 Sunmore Ln
- 7100 Sunbridge Ln
- 6758 Sandylee Way
- 6750 Sandylee Way
- 6762 Sandylee Way
- 6746 Sandylee Way
- 6747 Sandylee Way
- 6766 Sandylee Way
- 6742 Sandylee Way
- 6743 Sandylee Way
- 6767 Sandylee Way
- 6770 Sandylee Way
- 6738 Sandylee Way
- 6739 Sandylee Way
- 7343 Del Prado Ct
- 6773 Sandylee Way
- 6735 Sandylee Way
- 6734 Sandylee Way
- 6779 Sandylee Way
- 6774 Sandylee Way
- 7339 Del Prado Ct
- 6731 Sandylee Way