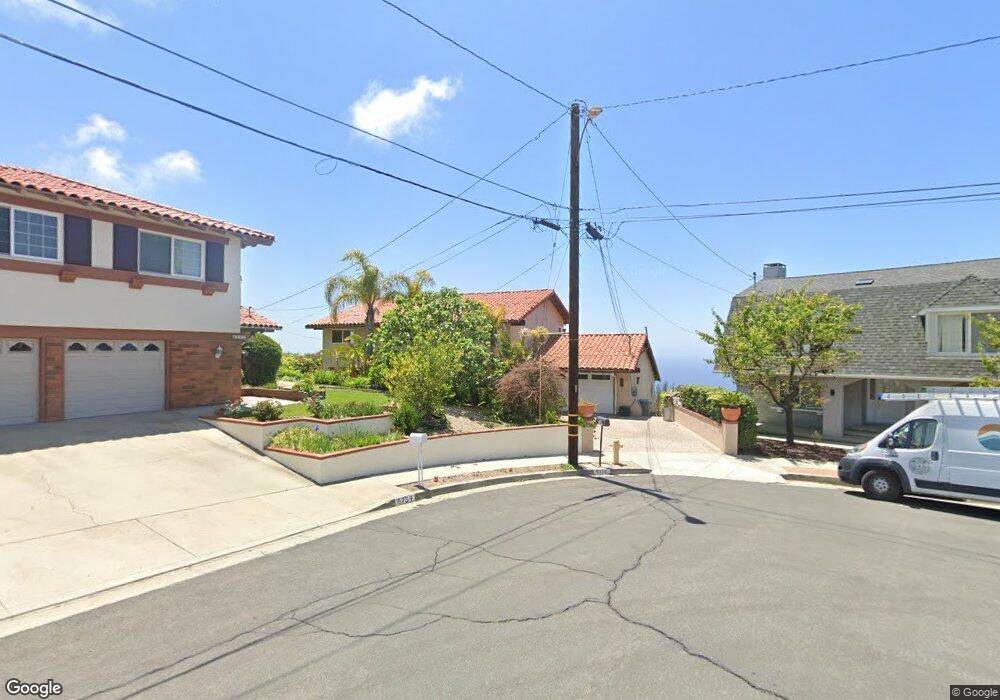
6756 Birchman Dr Rancho Palos Verdes, CA 90275
Estimated Value: $2,176,964 - $2,674,000
5
Beds
4
Baths
3,041
Sq Ft
$829/Sq Ft
Est. Value
About This Home
This home is located at 6756 Birchman Dr, Rancho Palos Verdes, CA 90275 and is currently estimated at $2,521,491, approximately $829 per square foot. 6756 Birchman Dr is a home located in Los Angeles County with nearby schools including Vista Grande Elementary, Ridgecrest Intermediate, and Palos Verdes Peninsula High School.
Ownership History
Date
Name
Owned For
Owner Type
Purchase Details
Closed on
Jun 14, 2013
Sold by
Mistry Sameer D
Bought by
Mistry Sameer D and Mistry Roma R
Current Estimated Value
Home Financials for this Owner
Home Financials are based on the most recent Mortgage that was taken out on this home.
Original Mortgage
$190,500
Interest Rate
3.38%
Mortgage Type
New Conventional
Purchase Details
Closed on
Mar 23, 2010
Sold by
Mistry Sameer D and Mistry Roma R
Bought by
Mistry Sameer D
Purchase Details
Closed on
Oct 6, 1995
Sold by
Thatcher Frank and Thatcher Joyce Catherine
Bought by
Mistry Sameer D and Mistry Roma R
Home Financials for this Owner
Home Financials are based on the most recent Mortgage that was taken out on this home.
Original Mortgage
$550,800
Outstanding Balance
$4,060
Interest Rate
8.12%
Estimated Equity
$2,517,431
Create a Home Valuation Report for This Property
The Home Valuation Report is an in-depth analysis detailing your home's value as well as a comparison with similar homes in the area
Home Values in the Area
Average Home Value in this Area
Purchase History
| Date | Buyer | Sale Price | Title Company |
|---|---|---|---|
| Mistry Sameer D | -- | Accommodation | |
| Mistry Sameer D | -- | Orange Coast Title Company O | |
| Mistry Sameer D | -- | None Available | |
| Mistry Sameer D | $612,000 | First American Title Co |
Source: Public Records
Mortgage History
| Date | Status | Borrower | Loan Amount |
|---|---|---|---|
| Closed | Mistry Sameer D | $190,500 | |
| Open | Mistry Sameer D | $550,800 |
Source: Public Records
Tax History Compared to Growth
Tax History
| Year | Tax Paid | Tax Assessment Tax Assessment Total Assessment is a certain percentage of the fair market value that is determined by local assessors to be the total taxable value of land and additions on the property. | Land | Improvement |
|---|---|---|---|---|
| 2025 | $12,111 | $1,036,868 | $641,572 | $395,296 |
| 2024 | $12,111 | $1,016,539 | $628,993 | $387,546 |
| 2023 | $11,845 | $996,608 | $616,660 | $379,948 |
| 2022 | $11,305 | $977,068 | $604,569 | $372,499 |
| 2021 | $11,260 | $957,911 | $592,715 | $365,196 |
| 2019 | $10,773 | $929,501 | $575,136 | $354,365 |
| 2018 | $10,649 | $911,276 | $563,859 | $347,417 |
| 2016 | $10,103 | $875,891 | $541,964 | $333,927 |
| 2015 | $10,003 | $862,736 | $533,824 | $328,912 |
| 2014 | $9,868 | $845,838 | $523,368 | $322,470 |
Source: Public Records
Map
Nearby Homes
- 28049 Lobrook Dr
- 28557 Blythewood Dr
- 6908 Willowtree Dr
- 6923 Willowtree Dr
- 28424 Golden Meadow Dr
- 28405 Golden Meadow Dr
- 1465 Via Coronel
- 28068 Santona Dr
- 1417 Vía Coronel
- 1413 Via Coronel
- 1501 Via Coronel
- 1409 Via Davalos
- 6307 Ridgeglade Ct
- 1232 Via Coronel
- 1520 Vía Zurita
- 28012 Ridgeforest Ct
- 1308 Via Coronel
- 1520 Paseo la Cresta
- 6701 Kings Harbor Dr
- 28022 Ridgecove Ct N
- 6754 Birchman Dr
- 6762 Birchman Dr
- 28114 Lobrook Dr
- 28220 Lobrook Dr
- 28104 Lobrook Dr
- 6748 Birchman Dr
- 28228 Lobrook Dr
- 6757 Birchman Dr
- 6745 Birchman Dr
- 28066 Lobrook Dr
- 28066 Lobrook Dr
- 28232 Lobrook Dr
- 6742 Birchman Dr
- 28207 Lobrook Dr
- 28119 Lobrook Dr
- 6755 Birchman Dr
- 28125 Lobrook Dr
- 28127 Lobrook Dr
- 28060 Lobrook Dr
- 28113 Lobrook Dr